如何在平滑散点图中正确设置日期字段的格式?
我的数据如下所示:
> head(data)
                 date    price volume
1 2011-06-26 17:16:05 17.51001  2.000
2 2011-06-26 20:50:00 14.80351  2.981
3 2011-06-26 20:51:00 14.90000  2.000
4 2011-06-26 20:52:00 14.89001  0.790
5 2011-06-26 20:53:00 15.00000  1.000
6 2011-06-26 21:05:01 16.20000  6.500
> str(head(data))
'data.frame':   6 obs. of  3 variables:
 $ date  : POSIXct, format: "2011-06-26 17:16:05" "2011-06-26 20:50:00" "2011-06-26 20:51:00" "2011-06-26 20:52:00" ...
 $ price : num  17.5 14.8 14.9 14.9 15 ...
 $ volume: num  2 2.98 2 0.79 1 ...
当我像这样绘制它时:
someColors <- colorRampPalette(c("black", "blue", "orange", "red"), space="Lab")
smoothScatter(data, colramp=someColors)
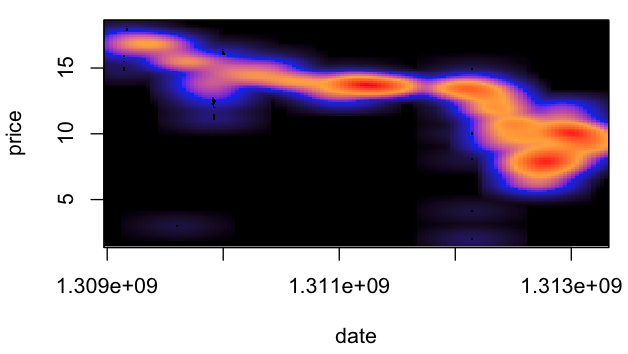
我几乎得到了我正在寻找的内容,但它将 posix 日期转换为数字。如何更有效地设置 x 标签,以便我的内容更具可读性?

(来源:skitch.com)
编辑:我可以像这样得到我想要的近似值:
smoothScatter(data, colramp=someColors, xaxt="n")
axis(1, at=data$date,
     labels=lapply(data$date, function(d) strftime(d, "%F")),
     tick=FALSE)
不过,这非常慢。看来我应该能够准备数据或为标签抽屉提供一些建议。
I have data that looks like this:
> head(data)
                 date    price volume
1 2011-06-26 17:16:05 17.51001  2.000
2 2011-06-26 20:50:00 14.80351  2.981
3 2011-06-26 20:51:00 14.90000  2.000
4 2011-06-26 20:52:00 14.89001  0.790
5 2011-06-26 20:53:00 15.00000  1.000
6 2011-06-26 21:05:01 16.20000  6.500
> str(head(data))
'data.frame':   6 obs. of  3 variables:
 $ date  : POSIXct, format: "2011-06-26 17:16:05" "2011-06-26 20:50:00" "2011-06-26 20:51:00" "2011-06-26 20:52:00" ...
 $ price : num  17.5 14.8 14.9 14.9 15 ...
 $ volume: num  2 2.98 2 0.79 1 ...
When I plot it like this:
someColors <- colorRampPalette(c("black", "blue", "orange", "red"), space="Lab")
smoothScatter(data, colramp=someColors)
I get almost exactly what I'm looking for, but it converts the posix dates to numbers. How can I set the x labels more usefully so that my stuff is a bit more readable?

(source: skitch.com)
Edit: I can get an approximation of what I want like this:
smoothScatter(data, colramp=someColors, xaxt="n")
axis(1, at=data$date,
     labels=lapply(data$date, function(d) strftime(d, "%F")),
     tick=FALSE)
That's terribly slow, though. It seems like I should be able to prep the data or advice the label drawer a bit.
如果你对这篇内容有疑问,欢迎到本站社区发帖提问 参与讨论,获取更多帮助,或者扫码二维码加入 Web 技术交流群。

绑定邮箱获取回复消息
由于您还没有绑定你的真实邮箱,如果其他用户或者作者回复了您的评论,将不能在第一时间通知您!

发布评论
评论(1)
就速度而言,指定用于 x 轴标签的日期范围可能会有所帮助。例如:
将时间四舍五入到最近的一天也可能有所帮助:
In terms of speed, it might help to specify range of dates to use for the x-axis labels. For example:
It might also help to round the times to the nearest day: