如何在Mathematica中获得准确的绘图曲线?
在 Mathematica 中运行以下代码:
r=6197/3122;
p[k_,w_]:=Sqrt[w^2/r^2-k^2];q[k_,w_]:=Sqrt[w^2-k^2];
a[k_,w_,p_,q_]:=(k^2-q^2)^2 Sin[p]Cos[q]+4k^2 p q Cos[p]Sin[q]
a[k_,w_]:=a[k,w,p[k,w],q[k,w]];
ContourPlot[a[k,w]==0,{w,0,6},{k,0,14}]
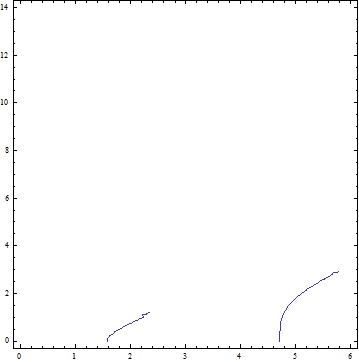
这给了我非常不准确的曲线:

我有尝试将 ContourPlot 的 PlotPoints 和 WorkingPrecision 选项分别设置为 30 和 20,但无济于事。您还会注意到,唯一的数字参数 r 是一个精确的有理数。我不知道还能尝试什么。谢谢。
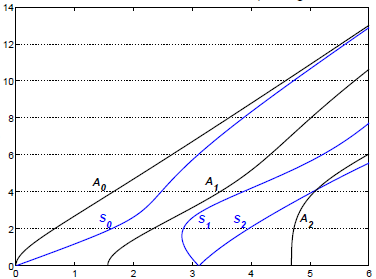
编辑:我期望得到的曲线是下图中的三个黑色曲线(标记为 A1、A2 和 A3)

Run the following code In Mathematica:
r=6197/3122;
p[k_,w_]:=Sqrt[w^2/r^2-k^2];q[k_,w_]:=Sqrt[w^2-k^2];
a[k_,w_,p_,q_]:=(k^2-q^2)^2 Sin[p]Cos[q]+4k^2 p q Cos[p]Sin[q]
a[k_,w_]:=a[k,w,p[k,w],q[k,w]];
ContourPlot[a[k,w]==0,{w,0,6},{k,0,14}]
This gives me very inaccurate curves:

I have tried setting the PlotPoints and WorkingPrecision options of ContourPlot to 30 and 20 respectively, to no avail. You will also notice that the only numerical parameter, r, is an exact rational number. I don't know what else to try. Thanks.
Edit: The curves I expect to get are the three black ones (marked A1, A2, and A3) on the following picture

如果你对这篇内容有疑问,欢迎到本站社区发帖提问 参与讨论,获取更多帮助,或者扫码二维码加入 Web 技术交流群。

绑定邮箱获取回复消息
由于您还没有绑定你的真实邮箱,如果其他用户或者作者回复了您的评论,将不能在第一时间通知您!

发布评论
评论(5)
您确定
a的图片和/或定义吗?根据a的定义可知,k==w上的a[k,w]==0但该曲线并未出现在你的照片中。无论如何,假设 a 的定义是正确的,绘制等值线的问题是在域 w^2/r^2-k^2<0 中,
p[k,w]和Sin[p[k,w]]都变成纯虚数,这意味着a[k,w]也变得纯粹是想象的。由于ContourPlot不喜欢复值函数,因此仅绘制域w^2/r^2>=k^2中的等高线部分。并不是说
Sin[p[k,w]]/p[k,w]对于所有k和w值都是实数(并且它在限制p[k,w]->0) 中表现良好。因此,为了解决a变得复杂的问题,您可以绘制轮廓a[k,w]/p[k,w]==0来代替:结果
Are you sure about the picture and/or the definition for
a? From the definition ofait follows thata[k,w]==0onk==wbut that curve doesn't appear in your picture.Anyway, assuming that the definition of
ais right, the problem with plotting the contours is that in the domainw^2/r^2-k^2<0, bothp[k,w]andSin[p[k,w]]become purely imaginary which means thata[k,w]becomes purely imaginary as well. SinceContourPlotdoesn't like complex valued functions only the parts of the contours in the domainw^2/r^2>=k^2are plotted.Not that
Sin[p[k,w]]/p[k,w]is real for all values ofkandw(and it's nicely behaved in the limitp[k,w]->0). Therefore, to get around the problem ofabecoming complex you could plot the contoursa[k,w]/p[k,w]==0instead:Result
通过单独绘制方程 lhs 的实部和虚部,我得到了与您期望的非常相似的结果:
I have got something very similar to what you expect by separate plotting of real and imaginary parts of the l.h.s. of the equation:
您的函数在您显示的轮廓线区域中给出复数。这是你所期望的吗?您可以在这里看到真实的区域:
如果我在某些方面得到一些更接近您的线条的东西使用:
是否可能存在转录错误?
(如果这没有帮助,我深表歉意。)
Your function gives complex numbers in the region of the contour lines you show. Is that what you expect? You can see the region that is real here:
I get something in some ways closer to your lines if I use:
Is it possible there is a transcription error?
(My apologies if this is unhelpful.)
仅当
w^2 - k^2和w^2/r^2 - k 时,都是非负的。p和q才是实值^2w^2 / r^2 - k^2仅在绘图区域的以下区域中为非负数:因此,其他所有内容都将被
ContourPlot截断。也许您需要对方程进行一些修正(您只需要实部?幅度?)我不相信 Mathematica 给您的曲线非常不准确。否则,如果增加PlotPoints和MaxRecursion(例如,增加到 50 和 4),则可以提高轮廓的准确性。pansqwill be real valued only ifw^2 - k^2andw^2/r^2 - k^2are both nonnegative.w^2 / r^2 - k^2will only be nonnegative in the following area of your plot region:Therefore everything else will be cut off by
ContourPlot. Perhaps you need to make some corrections to the equations (you only need the real part? magnitude?) I don't believe the curves Mathematica gives you are very inaccurate. Otherwise the way to go to increase accuracy of the contours if increasingPlotPointsandMaxRecursion(say, to 50 and 4).尝试使用方程的参数化。例如,定义
a=w^2-k^2和b=w^2/r^2-k^2,然后求解a< /code> 和b并将它们映射到k和wTry to play with the parametrization of your equations. For example, define
a=w^2-k^2andb=w^2/r^2-k^2, then solve foraandband map them ontokandw