使用 Mathematica 条形图中的 LabelingFunction 调整字体
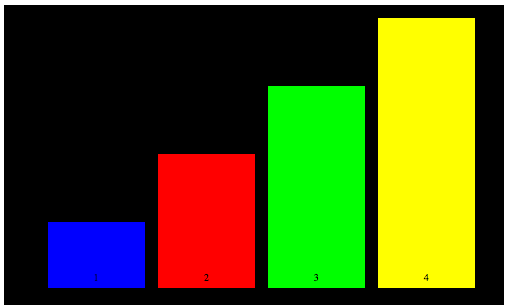
考虑以下条形图:
如何调整标签功能以及图表标签的字体?
我尝试过嵌套样式。不成功。
BarChart[{1, 2, 3, 4},
ChartStyle -> {Blue, Red, Green, Yellow},
LabelStyle -> Directive[Black, Large],
ChartLabels -> {"COG1", "COG2", "COG3", "COG4"},
ImageSize -> {500, 300},
ChartBaseStyle -> EdgeForm[Thick],
LabelingFunction -> Bottom,
Background -> Black,
LabelStyle -> Directive[Black, Large]]

Considering the following BarChart :
How Could I adjust the Font for the Labeling Function as well as the Chart Labels ?
I tried nesting Style. Unsuccessfull.
BarChart[{1, 2, 3, 4},
ChartStyle -> {Blue, Red, Green, Yellow},
LabelStyle -> Directive[Black, Large],
ChartLabels -> {"COG1", "COG2", "COG3", "COG4"},
ImageSize -> {500, 300},
ChartBaseStyle -> EdgeForm[Thick],
LabelingFunction -> Bottom,
Background -> Black,
LabelStyle -> Directive[Black, Large]]

如果你对这篇内容有疑问,欢迎到本站社区发帖提问 参与讨论,获取更多帮助,或者扫码二维码加入 Web 技术交流群。

绑定邮箱获取回复消息
由于您还没有绑定你的真实邮箱,如果其他用户或者作者回复了您的评论,将不能在第一时间通知您!

发布评论
评论(1)
你的意思是这样的吗?
编辑
更改坐标区的样式。
Do you mean something like this?
Edit
Change the style of the axes.