使用动态数据显示的 WPF 图表:如何显示回归线?
我正在使用 动态数据显示 (D3) 来渲染一些简单的 LineSeries在图表上:
<d3:ChartPlotter>
    <d3:CursorCoordinateGraph/>
    <d3:LineGraph DataSource="{Binding SelectedGraphValues}"/>
    <!-- ... Snip ...-->
</d3:ChartPlotter>
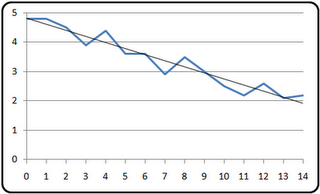
这是一个小示例图:
* 图片来自 http://dynamicnotions.blogspot.com/2009 /05/linear-regression-in-c.html
有没有一种简单的方法可以用 D3 来做到这一点?还是我必须自己计算?我只是想在重新发明轮子之前检查一下:-)
D3 是一个非常简洁的库,尽管它缺少一些文档......
I'm using Dynamic Data Display (D3) to render a few simple LineSeries on a chart:
<d3:ChartPlotter>
    <d3:CursorCoordinateGraph/>
    <d3:LineGraph DataSource="{Binding SelectedGraphValues}"/>
    <!-- ... Snip ...-->
</d3:ChartPlotter>
here is a small example graph:
* image from http://dynamicnotions.blogspot.com/2009/05/linear-regression-in-c.html
Is there a simple way to do this with D3? Or do I have to make the calculations myself? I just want to check before I reinvent the wheel here :-)
D3 is a very neat library, altough it's lacking a bit in documentation...
如果你对这篇内容有疑问,欢迎到本站社区发帖提问 参与讨论,获取更多帮助,或者扫码二维码加入 Web 技术交流群。

绑定邮箱获取回复消息
由于您还没有绑定你的真实邮箱,如果其他用户或者作者回复了您的评论,将不能在第一时间通知您!

发布评论
评论(1)
经过一些研究并查看 DynamicDataDisplay 的示例后,我猜它不是内置的(不过也可能是这样,该库中有很多东西!)
所以我刚刚创建了一个新的 LineGraph 和一个新的
ObservableDataSource将其绑定到,并自己计算回归。After some research and going through samples from DynamicDataDisplay, I guess it's not built in (could've been though, there's a lot of stuff in that library!)
So I just created a new
LineGraphand a newObservableDataSourceto bind it to, and calculated the regression myself.