ggplot2 对象的动态位置(尤其是 geom_text)?
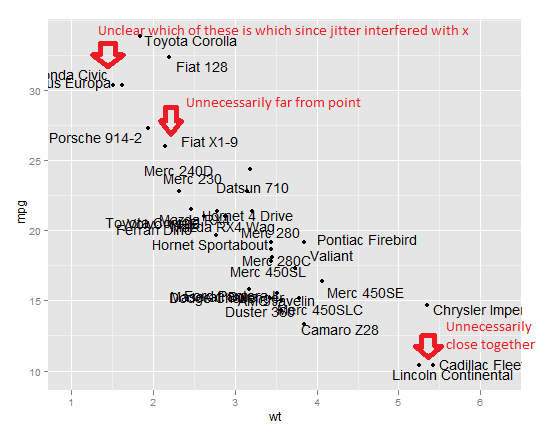
使用 ArcGIS 制作地图时,该软件默认会自动推送点和多边形标签,以避免使用专有算法发生重叠。他们将此称为动态标签。 ggplot2 具有 position_jitter,对于点来说非常有用(因为动态标签可能会产生系统偏差),但对于使用 geom_text 的标签来说不太好。
以下是动态标签算法可以解决的一些抖动问题的示例:
library(ggplot2)
ggplot( mtcars,aes( x=wt, y=mpg, label=rownames(mtcars) ) ) +
  geom_point() +
  geom_text( position=position_jitter(h=1,w=1) )

是否执行这样的动态标签ggplot2 中已经存在该功能吗?
如果没有,有哪些算法可以实现这一点?是否可以在 R 中实现 position_dynamic?
When using ArcGIS to make maps, the software by default pushes point and polygon labels around automatically to avoid overlap using a proprietary algorithm. They refer to this as dynamic labeling. ggplot2 has position_jitter which is excellent for points (since dynamic labeling might create systematic bias), but less good for labels using geom_text.
Here's an example of some problems with jitter that a dynamic labeling algorithm might solve:
library(ggplot2)
ggplot( mtcars,aes( x=wt, y=mpg, label=rownames(mtcars) ) ) +
  geom_point() +
  geom_text( position=position_jitter(h=1,w=1) )

Does such a dynamic labeling feature exist already in ggplot2?
If not, what algorithms exist for doing so and is it possible to implement a position_dynamic in R?
如果你对这篇内容有疑问,欢迎到本站社区发帖提问 参与讨论,获取更多帮助,或者扫码二维码加入 Web 技术交流群。

绑定邮箱获取回复消息
由于您还没有绑定你的真实邮箱,如果其他用户或者作者回复了您的评论,将不能在第一时间通知您!

发布评论
评论(4)
AFAIK,现有的最好的是
directlabels,可从 R-forge 获取 和 CRAN 以及全面的 示例页面。这似乎是一个很好的起点,但在我看来有以下负面影响:
group美学,而不适用于个别点我前段时间浏览过源代码,我认为调整代码来解决我提到的这两点应该相当容易。
这个问题中有一个如何将其与
ggplot一起使用的示例AFAIK, the best that exists is
directlabels, available from R-forge and CRAN and with a comprehensive examples page.This seems a good starting point, but in my opinion has the following negative aspects:
ggplotphilosophy of separating data and presentation,directlabelsreturns a ggplot object rather than a geomgroupaesthetic, not individual pointsI have glanced at the source code some time ago and I think it should be reasonably easy to adapt the code to address both points I mention.
There is an example of how to use this with
ggplotin this question on SO这不是任何可以直接在 ggplot2 中使用的东西,但是 vegan 包中的
ordipointlabel()函数尝试做类似的事情。它将数据显示为点,并尝试使用适当的标签来标记每个点,使用优化算法将标签放置在其点旁边,但不与其他标签和点重叠。?ordipointlabel提到它基于 maptools 包中的pointlabel(),这可能是另一个寻找灵感的地方。This isn't anything that can be used directly in ggplot2, but the
ordipointlabel()function in package vegan tries to do something similar. It displays data as points and tries to label each point with the appropriate label, using an optimisation algorithm to position the labels next to their point but without overlapping other labels and points.?ordipointlabelmentions that it is based onpointlabel()in the maptools package, which could be another place to look for inspiration.查看新包 ggrepel。
ggrepel 为 ggplot2 提供几何图形来排斥重叠的文本标签。它适用于 geom_text 和 geom_label。
图取自这篇博文。
Check out the new package ggrepel.
ggrepel provides geoms for ggplot2 to repel overlapping text labels. It works both for geom_text and geom_label.
Figure is taken from this blog post.
我在处理几个绘图时遇到了类似的问题,并编写了一个基本包,该包使用力场模拟来调整对象位置。虽然可以进行很多改进,包括与 ggplot 集成等,但它似乎完成了任务。下图说明了该功能:
I ran into a similar problem with several of the plots I have been working with and wrote a basic package that uses force field simulation to adjust object location. While much improvement is possible, including integration with ggplot, etc. it seems to get the task accomplished. The following illustrates the functionality: