ggplot2:轴上的大括号?
在回答最近的可视化问题中,我确实需要大括号来显示跨度在一个轴上,我不知道如何在 ggplot2 中做到这一点。这是情节:

我真的很喜欢 y 轴标签“第二个字母,而不是刻度线” -字母名称”有一个从 1 延伸到 10 的大括号(红色和蓝色第二个字母的垂直跨度)。但我不确定如何实现这一点。 x 轴可以从类似的处理中受益。
链接的 CrossValidated 问题中提供了代码(对于本示例来说不必要地复杂,因此我不会显示它)。相反,这里有一个最小的示例:
library(ggplot2)
x <- c(runif(10),runif(10)+2)
y <- c(runif(10),runif(10)+2)
qplot(x=x,y=y) +
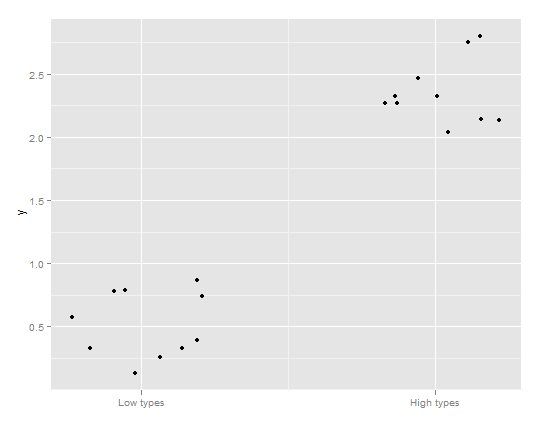
  scale_x_continuous("",breaks=c(.5,2.5),labels=c("Low types","High types") )

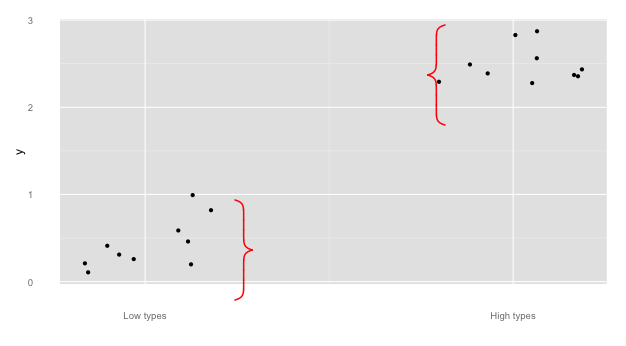
在这种情况下,大括号来自 (0,1) 表示低类型,来自(2,3) 对于高类型来说是理想的选择,而不是刻度线。
我不想使用 geom_rect 因为:
- 刻度线将保留
- 我更喜欢大括号
- 它将位于绘图内部而不是外部
我将如何实现这一点?完美的答案是:
- 一个漂亮、光滑、细的大括号
- 在绘图区域之外绘制
- 通过高级参数指定(理想情况下是传递给scale_x_continuous中的breaks选项的范围类型对象) )
In answering a recent visualization question I really needed braces to show a span on an axis, and I can't figure out how to do it in ggplot2. Here's the plot:

Instead of a tick mark, I'd really like the y axis label "Second letter of two-letter names" to have a brace extending from 1 to 10 (the vertical span of the red and blue second letters). But I'm not sure how to make that happen. The x axis could benefit from similar treatment.
Code is available in the linked CrossValidated question (and unnecessarily complicated for this example, so I won't show it). Instead, here's a minimal example:
library(ggplot2)
x <- c(runif(10),runif(10)+2)
y <- c(runif(10),runif(10)+2)
qplot(x=x,y=y) +
  scale_x_continuous("",breaks=c(.5,2.5),labels=c("Low types","High types") )

In this case, a brace from (0,1) for low types and from (2,3) for the high types would be ideal instead of tick marks.
I'd rather not use geom_rect because:
- The tick marks will remain
- I'd prefer braces
- It will be inside the plot instead of outside it
How would I accomplish this? The perfect answer would have:
- A nice, smooth, thin curly brace
- Drawn outside the plotting area
- Specified via a high-level argument (ideally a range-type object passed to the
breaksoption inscale_x_continuous)
如果你对这篇内容有疑问,欢迎到本站社区发帖提问 参与讨论,获取更多帮助,或者扫码二维码加入 Web 技术交流群。

绑定邮箱获取回复消息
由于您还没有绑定你的真实邮箱,如果其他用户或者作者回复了您的评论,将不能在第一时间通知您!

发布评论
评论(6)
另一种解决方案使用绘制大括号的函数。
谢谢古尔!
Another solution using a function that draws a curly bracket.
Thanks Gur!
更新:如果您需要保存绘图,请务必查看相关的 Stackoverflow 问答使用 ggsave() 并使括号保留在保存的图像中。
OP 要求支架不在图上。此解决方案结合使用 axis.ticks.length 和 axis.ticks = element_blank() 来允许大括号位于绘图区域之外。
这个答案建立在 @Pankil 和 @user697473 的基础上:我们将使用
pBracketsR 包 - 并包含图片!关于 @Pankil 答案的快速注释:
还有更多内容来展示
pBrackets的功能:<一href="https://i.sstatic.net/RBwRO.png" rel="noreferrer">
Update: Be sure to see this related Stackoverflow Q&A if you need to save the plot with ggsave() and have the brackets persist in the saved image.
The OP requested the bracket be off the plot. This solution uses
axis.ticks.lengthin combination withaxis.ticks = element_blank()to allow the brace to be outside the plotting area.This answer builds upon those of @Pankil and @user697473: we will use
pBracketsR package -- and include pictures!A quick note on @Pankil's answer:
And a couple more to showcase functionality of
pBrackets:这是 ggplot 中的一个笨拙的解决方案,它构建了一个隐约类似于大括号的线条图。
构造一个函数,将大括号的位置和尺寸作为输入。该函数的作用是指定支架轮廓图的坐标,并使用一些数学缩放来使其达到所需的大小和位置。您可以利用这一原理并修改坐标以获得任何所需的形状。原则上,您可以使用相同的概念并添加曲线、椭圆等。
将其传递给
ggplot,特别是geom_lineHere is kludgy solution in
ggplotthat constructs a line drawing that vaguely resembles a curly bracket.Construct a function that takes as input the position and dimensions of a curly bracket. What this function does is to specify the co-ordinates of an outline drawing of a bracket and uses some math scaling to get it to the size and position desired. You can use this principle and modify the co-ordinates to give you any desired shape. In principle you can use the same concept and add curves, ellipses, etc.
Pass that to
ggplotand specificallygeom_line正如 @user697473 所建议的,
pBrackets是一个优雅的解决方案。它与默认绘图命令配合使用效果最佳,但要使其与 GGplot2 配合使用,请使用 pBracket::grid.brackets 。我添加了代码,以便于尝试。
从您的代码开始..
最后一行删除您不需要的勾号。
现在,
pBrackets现在使用光标识别图表上括号开始和结束的点。您将获得“本地”单位中的相应坐标。现在在下面的命令中输入它们
您可以在图表上的任何位置添加括号,甚至使用
grid.text添加文本。希望这有帮助!谢谢
pBrackets!潘基尔!
as @user697473 suggested
pBracketsis the elegant solution.It works best with the default plotting commands but to make it work with GGplot2 use the
pBracket::grid.brackets. I'm including the code to make it easy for try it out.Starting with your code..
the last line removes the ticks you didn't want.
Now the
pBracketsnow using your cursor identify the point on the graph where the brackets start and end. You will get the corresponding coordinates in the 'native' unit. now feed them in the command below
You can add the brackets anywhere on the graph or even add text using
grid.text.Hope this helps! Thank you
pBrackets!Pankil!
新的
pbrackets包可能会有所帮助:http:// /cran.r-project.org/web/packages/pBrackets/index.html。The new
pbracketspackage may help: http://cran.r-project.org/web/packages/pBrackets/index.html.#== 编辑: ggbrace 替换了 curlyBraces 包
这个答案确实很晚了,但是对于绘图区域内的大括号,我制作了一个小包 ggbrace 允许您使用带有指定坐标的大括号(易于使用):
基本上:
您可以自定义 x 和 y 坐标以及括号指向的位置。在这种特定情况下:
编辑:如果您希望大括号位于绘图区域之外,您可以设置一些 ggplot 参数。 ggbrace github 页面上有更详细的描述。
#== EDIT: ggbrace replaced the curlyBraces package
This answer is really late, but for braces inside the plotting area I made a small package ggbrace that lets you have curly braces with the coordinates you specify (easy to use):
basically:
you can customize x and y coordinates and where the bracket points to. In this specific case:
EDIT: If you want the braces outside of the plotting area, you can set some ggplot parameters. It is described in a little more detail on the ggbrace github page.