用ggplot2画一个圆

发布于 2024-11-26 23:26:58 字数 113 浏览 1 评论 0原文

也许这是一个愚蠢的问题,但我无法在 ggplot2 手册中找到答案,也无法在“阿姨”谷歌中找到答案...

如果我有一个中点和一个直径,如何用 ggplot2 作为附加层绘制一个圆? 感谢您的帮助。

Maybe it is a silly question, but I couldn't find the answer in the handbook of ggplot2 nor with "aunt" google...

How do I plot a circle with ggplot2 as an additional layer if I have a middle point and a diameter?
Thanks for your help.

如果你对这篇内容有疑问,欢迎到本站社区发帖提问 参与讨论,获取更多帮助,或者扫码二维码加入 Web 技术交流群。

扫码二维码加入Web技术交流群

发布评论

需要 登录 才能够评论, 你可以免费 注册 一个本站的账号。

评论(6

暗藏城府 2024-12-03 23:26:58

更新、更好的选项利用名为 ggforce 的扩展包,它定义了明确的 geom_circle

但为了后代的缘故,这里有一个简单的圆形函数:

circleFun <- function(center = c(0,0),diameter = 1, npoints = 100){
    r = diameter / 2
    tt <- seq(0,2*pi,length.out = npoints)
    xx <- center[1] + r * cos(tt)
    yy <- center[2] + r * sin(tt)
    return(data.frame(x = xx, y = yy))
}

以及它的使用演示:

dat <- circleFun(c(1,-1),2.3,npoints = 100)
#geom_path will do open circles, geom_polygon will do filled circles
ggplot(dat,aes(x,y)) + geom_path()

在此处输入图像描述

A newer, better option leverages an extension package called ggforce that defines an explicity geom_circle.

But for posterity's sake, here's a simple circle function:

circleFun <- function(center = c(0,0),diameter = 1, npoints = 100){
    r = diameter / 2
    tt <- seq(0,2*pi,length.out = npoints)
    xx <- center[1] + r * cos(tt)
    yy <- center[2] + r * sin(tt)
    return(data.frame(x = xx, y = yy))
}

And a demonstration of it's use:

dat <- circleFun(c(1,-1),2.3,npoints = 100)
#geom_path will do open circles, geom_polygon will do filled circles
ggplot(dat,aes(x,y)) + geom_path()

enter image description here

香橙ぽ 2024-12-03 23:26:58

如果目的只是注释一个圆,您可以简单地使用带有几何“路径”的注释。无需创建数据框或函数:

#g is your plot
#r, xc, yc are the radius and center coordinates

g<-g+annotate("path",
   x=xc+r*cos(seq(0,2*pi,length.out=100)),
   y=yc+r*sin(seq(0,2*pi,length.out=100)))

If the purpose is only to annotate a circle, you can simply use annotate with geometry "path". No need to create a data frame or function:

#g is your plot
#r, xc, yc are the radius and center coordinates

g<-g+annotate("path",
   x=xc+r*cos(seq(0,2*pi,length.out=100)),
   y=yc+r*sin(seq(0,2*pi,length.out=100)))
心舞飞扬 2024-12-03 23:26:58

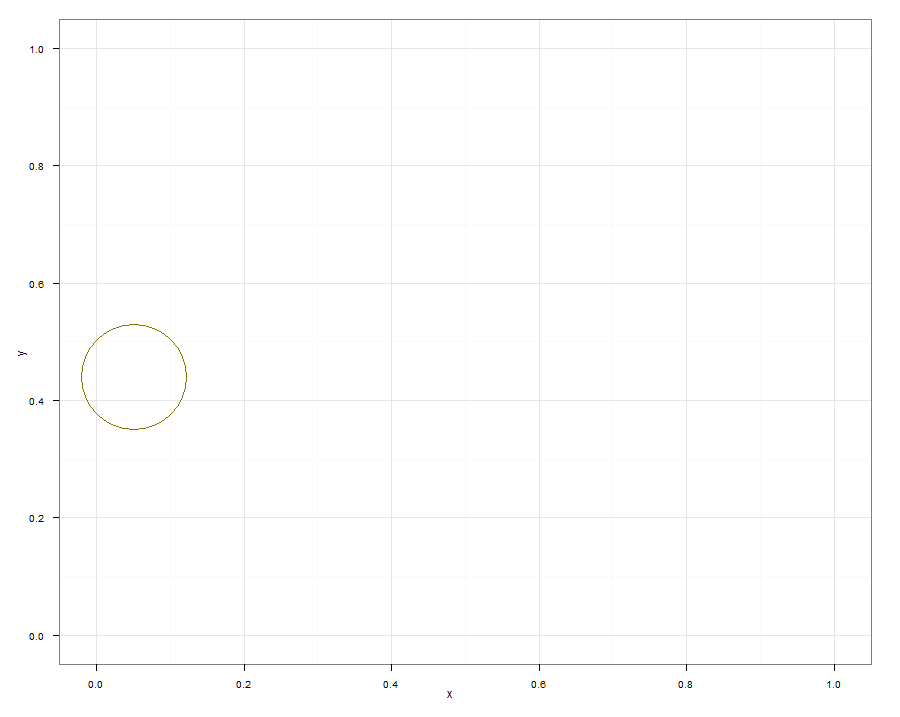
您好,来自 ggplot2 Google 小组的以下代码可能有用:

dat = data.frame(x=runif(1), y=runif(1))
ggplot() + scale_x_continuous(limits = c(0,1)) +
scale_y_continuous(limits = c(0,1))+
geom_point(aes(x=x, y=y), data=dat, size=50, shape=1, color="gold4")

生成:
在此处输入图像描述

我希望它可以帮助您开始根据自己的目的编写自定义示例。

Hi the following code from ggplot2 Google group may be useful:

dat = data.frame(x=runif(1), y=runif(1))
ggplot() + scale_x_continuous(limits = c(0,1)) +
scale_y_continuous(limits = c(0,1))+
geom_point(aes(x=x, y=y), data=dat, size=50, shape=1, color="gold4")

Which Produces:
enter image description here

I hope it gets you started in hacking up custom examples for your purpose.

涙—继续流 2024-12-03 23:26:58

使用 ggplot2 >= 0.9 你也可以这样做

library(grid)
qplot(1:10, 1:10, geom="blank") +
  annotation_custom(grob=circleGrob(r=unit(1,"npc")), xmin=2, xmax=4, ymin=4, ymax=6)

with ggplot2 >= 0.9 you can also do

library(grid)
qplot(1:10, 1:10, geom="blank") +
  annotation_custom(grob=circleGrob(r=unit(1,"npc")), xmin=2, xmax=4, ymin=4, ymax=6)
弄潮 2024-12-03 23:26:58

为了后代,这里有一个更灵活的圆形解决方案,使用 annotate 和 geom_ribbon,支持填充、颜色、alpha 和大小。

gg_circle <- function(r, xc, yc, color="black", fill=NA, ...) {
    x <- xc + r*cos(seq(0, pi, length.out=100))
    ymax <- yc + r*sin(seq(0, pi, length.out=100))
    ymin <- yc + r*sin(seq(0, -pi, length.out=100))
    annotate("ribbon", x=x, ymin=ymin, ymax=ymax, color=color, fill=fill, ...)
}
square <- ggplot(data.frame(x=0:1, y=0:1), aes(x=x, y=y))
square + gg_circle(r=0.25, xc=0.5, yc=0.5)
square + gg_circle(r=0.25, xc=0.5, yc=0.5, color="blue", fill="red", alpha=0.2)

For posterity's sake here is a more flexible circle solution using annotate and geom_ribbon that supports fill, color, alpha, and size.

gg_circle <- function(r, xc, yc, color="black", fill=NA, ...) {
    x <- xc + r*cos(seq(0, pi, length.out=100))
    ymax <- yc + r*sin(seq(0, pi, length.out=100))
    ymin <- yc + r*sin(seq(0, -pi, length.out=100))
    annotate("ribbon", x=x, ymin=ymin, ymax=ymax, color=color, fill=fill, ...)
}
square <- ggplot(data.frame(x=0:1, y=0:1), aes(x=x, y=y))
square + gg_circle(r=0.25, xc=0.5, yc=0.5)
square + gg_circle(r=0.25, xc=0.5, yc=0.5, color="blue", fill="red", alpha=0.2)
零度℉ 2024-12-03 23:26:58

也试试这个,

 ggplot() + geom_rect(aes(xmin=-1,ymin=-1,xmax=1,ymax=1), fill=NA) + coord_polar()

重点是,某些坐标系中的圆通常不是其他坐标系中的圆,除非您使用 geom_point。您可能希望确保笛卡尔坐标的纵横比为 1。

Also try this,

 ggplot() + geom_rect(aes(xmin=-1,ymin=-1,xmax=1,ymax=1), fill=NA) + coord_polar()

The point being, a circle in some coordinates system is often not a circle in others, unless you use geom_point. You might want to ensure an aspect ratio of 1 with cartesian coordinates.

~没有更多了~
我们使用 Cookies 和其他技术来定制您的体验包括您的登录状态等。通过阅读我们的 隐私政策 了解更多相关信息。 单击 接受 或继续使用网站,即表示您同意使用 Cookies 和您的相关数据。
原文