MS 图表控件:格式化轴标签
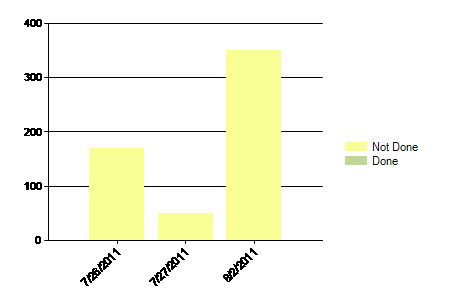
我对 MS ASP.NET 图表控件的轴标签格式有疑问。在我深入探讨我的问题之前,请先看一下这个屏幕截图。

正如您在屏幕截图中看到的,轴标签很难阅读并且看起来是粗体的。现在,我的问题是:
- 哪些默认图表属性导致轴标签看起来不像 Arial 11px 常规,即粗体和闭合字符?
- 轴标签的外观如何更易于阅读和清理,即常规字体粗细和字符之间的分隔?
负责的代码是:
public Chart GetChart(ChartData chartDataData, IChartSettings settings)
{
    var chart = new Chart
    {
        BackColor = Color.Transparent,
        Height = settings.Height,
        Palette = ChartColorPalette.None,
        PaletteCustomColors = settings.PaletterCustomColors.ToArray(),
        Width = settings.Width
    };
    if (settings.ShowLegend)
    {
        chart.Legends.Add("Legend").Alignment = StringAlignment.Center;
    }
    AddChartArea(chart);

    foreach (var seriesData in chartDataData.Series)
    {
        AddSeries(chart, seriesData, settings.ChartType);
    }

    chart.AlignDataPointsByAxisLabel();
    return chart;
}

private void AddChartArea(Chart chart)
{
    var area = new ChartArea();
    area.AxisX.LabelStyle.Angle = -45;
    area.AxisX.MajorGrid.LineColor = Color.Transparent;
    chart.ChartAreas.Add(area);
    area.AxisX.LabelStyle.Font = area.AxisY.LabelStyle.Font = new Font("Arial", 11, GraphicsUnit.Pixel);
}

private void AddSeries(Chart chart, SeriesData data, SeriesChartType chartType)
{
    var series = new Series
    {
        ChartType = chartType,
        Name = data.Name,
        ToolTip = data.Name,
        Url = data.Url
    };

    foreach (var pointData in data.Points)
    {
        AddPoint(series, pointData.XValue, pointData.YValue);
    }
    chart.Series.Add(series);
}

private void AddPoint(Series series, string xValue, float yValue)
{
    var point = new DataPoint
    {
        AxisLabel = xValue
    };
    point.SetValueXY(xValue, yValue);
    series.Points.Add(point);
}
设置对象的代码是:
public static ChartSettings TaskSummary = new ChartSettings
{
    ChartType = SeriesChartType.StackedColumn,
    Height = Unit.Pixel(300),
    Width = Unit.Pixel(450),
    PaletterCustomColors = new[]
    {
        Color.FromArgb(191, 214, 151),
        Color.FromArgb(249, 255, 149),
        Color.FromArgb(191, 79, 75),
        Color.Green
    },
    ShowLegend = true
};
感谢您的帮助。
I have questions about formatting the axis labels of the MS ASP.NET chart control. Before I dive into my questions, please take a look at this screenshot.

As you can see in the screenshot, the axis labels are hard to read and appear to be bolded. Now, my questions are:
- Which default chart properties cause the axis labels to not look like Arial 11px regular, i.e. bolding and close characters?
- How can the appearance of the axis labels be easier to read and cleaned up, i.e. regular font weight and separation between characters?
The responsible code is:
public Chart GetChart(ChartData chartDataData, IChartSettings settings)
{
    var chart = new Chart
    {
        BackColor = Color.Transparent,
        Height = settings.Height,
        Palette = ChartColorPalette.None,
        PaletteCustomColors = settings.PaletterCustomColors.ToArray(),
        Width = settings.Width
    };
    if (settings.ShowLegend)
    {
        chart.Legends.Add("Legend").Alignment = StringAlignment.Center;
    }
    AddChartArea(chart);

    foreach (var seriesData in chartDataData.Series)
    {
        AddSeries(chart, seriesData, settings.ChartType);
    }

    chart.AlignDataPointsByAxisLabel();
    return chart;
}

private void AddChartArea(Chart chart)
{
    var area = new ChartArea();
    area.AxisX.LabelStyle.Angle = -45;
    area.AxisX.MajorGrid.LineColor = Color.Transparent;
    chart.ChartAreas.Add(area);
    area.AxisX.LabelStyle.Font = area.AxisY.LabelStyle.Font = new Font("Arial", 11, GraphicsUnit.Pixel);
}

private void AddSeries(Chart chart, SeriesData data, SeriesChartType chartType)
{
    var series = new Series
    {
        ChartType = chartType,
        Name = data.Name,
        ToolTip = data.Name,
        Url = data.Url
    };

    foreach (var pointData in data.Points)
    {
        AddPoint(series, pointData.XValue, pointData.YValue);
    }
    chart.Series.Add(series);
}

private void AddPoint(Series series, string xValue, float yValue)
{
    var point = new DataPoint
    {
        AxisLabel = xValue
    };
    point.SetValueXY(xValue, yValue);
    series.Points.Add(point);
}
where the code for the settings object is:
public static ChartSettings TaskSummary = new ChartSettings
{
    ChartType = SeriesChartType.StackedColumn,
    Height = Unit.Pixel(300),
    Width = Unit.Pixel(450),
    PaletterCustomColors = new[]
    {
        Color.FromArgb(191, 214, 151),
        Color.FromArgb(249, 255, 149),
        Color.FromArgb(191, 79, 75),
        Color.Green
    },
    ShowLegend = true
};
Thanks for the help.
如果你对这篇内容有疑问,欢迎到本站社区发帖提问 参与讨论,获取更多帮助,或者扫码二维码加入 Web 技术交流群。

绑定邮箱获取回复消息
由于您还没有绑定你的真实邮箱,如果其他用户或者作者回复了您的评论,将不能在第一时间通知您!

发布评论
评论(1)
如果将图表的BackColor设置为
Color.Transparent,则需要设置AntiAliasing="Graphics"。If you set BackColor of the chart to
Color.Transparent, You need to setAntiAliasing="Graphics".