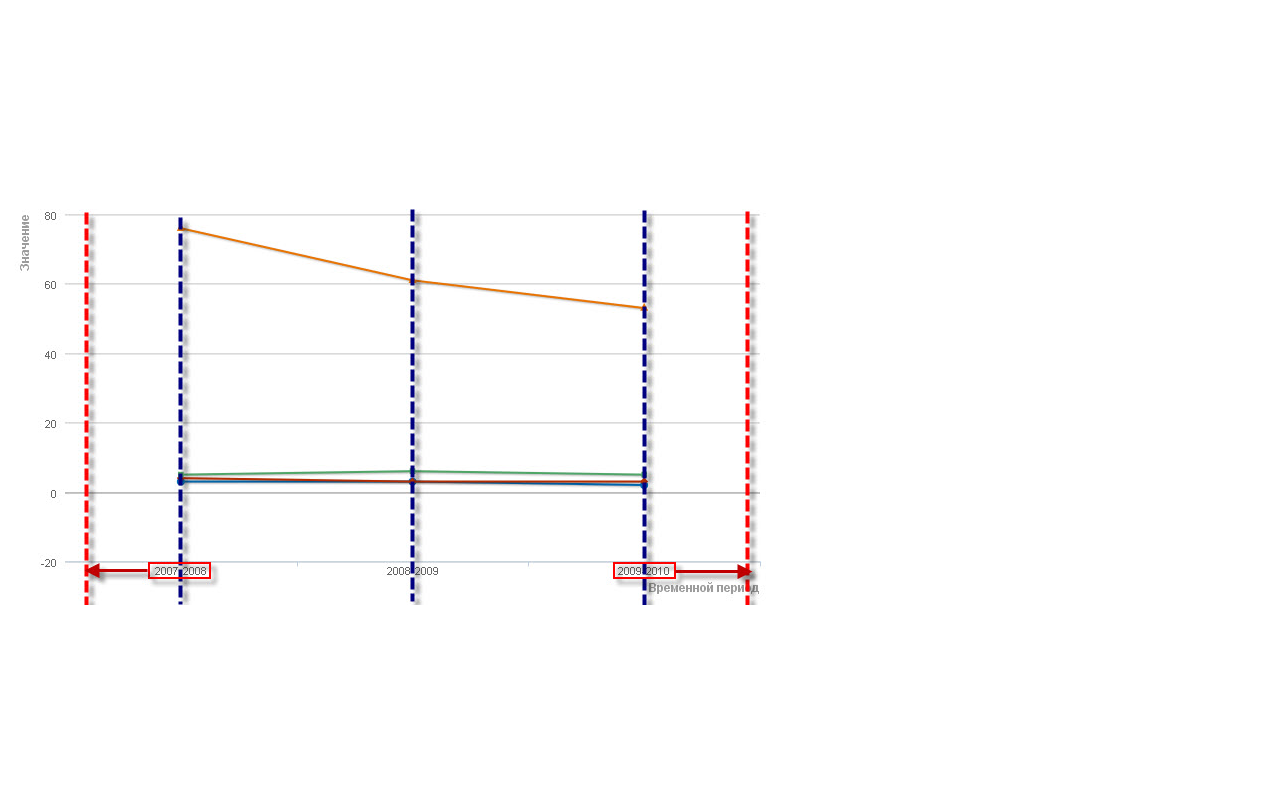
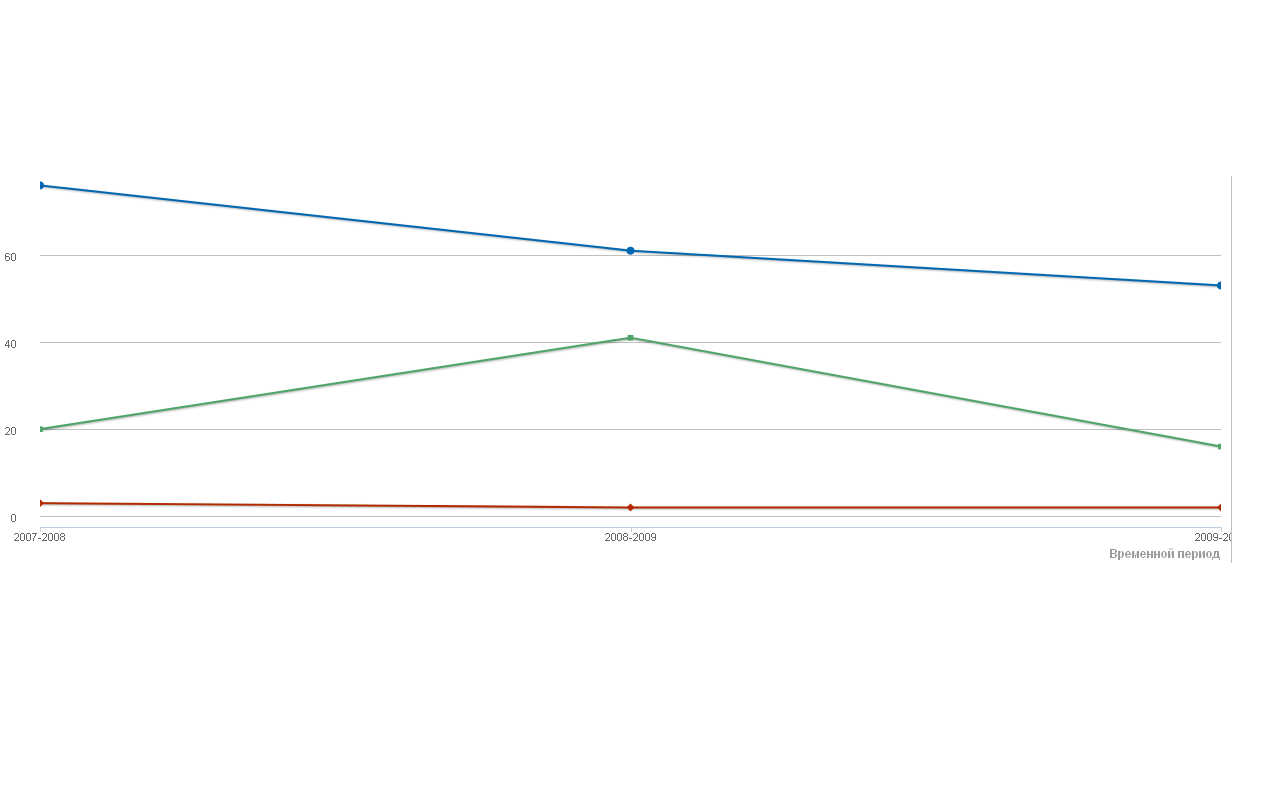
如何在 Highcharts 中的最高 x 值和绘图的右侧间隙之间进行填充?
我需要删除线条和绘图间隙之间的边距。  我决定使用 startOnTick 和 endOnTick 属性,但在这种情况下,看不到间隙中的线点或仅看到其中的一部分。
当然,如果你知道怎么做,请帮忙)))
I need to delete the margins between my lines and plot gap. 
I decided to use the startOnTick and endOnTick property but in this case line's points in the gap are not seen or seen only part of them.
Please, help if you know how, of course)))
如果你对这篇内容有疑问,欢迎到本站社区发帖提问 参与讨论,获取更多帮助,或者扫码二维码加入 Web 技术交流群。

绑定邮箱获取回复消息
由于您还没有绑定你的真实邮箱,如果其他用户或者作者回复了您的评论,将不能在第一时间通知您!

发布评论
评论(1)
您可以在提供给构造函数的图表选项中设置
maxPadding和minPadding。或者,您可以在实例化动态值图表后使用
setExtremes(min, max)。You can set
maxPaddingandminPaddingwithin chart options provided to the constructor.Or you can use
setExtremes(min, max)after instantiate the chart for dynamic values.