MS 图表控件:在图表区域绘制和标记线系列
我对 MS ASP.NET 图表控件有疑问。
- 如何在条形系列上设置折线系列,使其延伸到图表的 y 轴?
- 是否可以将线系列的名称(即“目标”)放置在图表右侧,以替代在图例中包含该系列?
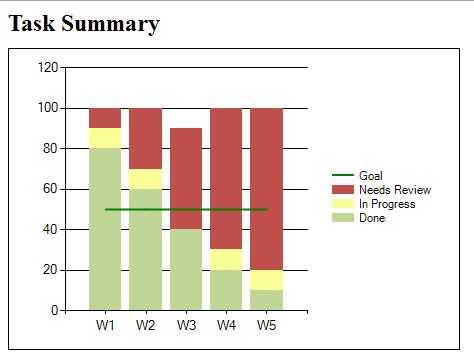
正如您在下面的屏幕截图中看到的,我在条形系列顶部呈现了一个线系列,该系列并未延伸到图表的 y 轴。

代码如下:
var data1 = new Dictionary<string, float>
{
    { "W1", 80},
    { "W2", 60},
    { "W3", 40},
    { "W4", 20},
    { "W5", 10}
};
var data2 = new Dictionary<string, float>
{
    { "W1", 10},
    { "W2", 10},
    { "W3", 0},
    { "W4", 10},
    { "W5", 10}
};
var data3 = new Dictionary<string, float>
{
    { "W1", 10},
    { "W2", 30},
    { "W3", 50},
    { "W4", 70},
    { "W5", 80}
};
var data4 = new Dictionary<string, float>
{
    { "W1", 50},
    { "W2", 50},
    { "W3", 50},
    { "W4", 50},
    { "W5", 50}
};

var chart = new Chart();
chart.Height = Unit.Pixel(300);
chart.Width = Unit.Pixel(450);
chart.Legends.Add("Legend").Alignment = StringAlignment.Center;
chart.Palette = ChartColorPalette.None;
chart.PaletteCustomColors = new Color[] { Color.FromArgb(191, 214, 151), Color.FromArgb(249, 255, 149), Color.FromArgb(191, 79, 75), Color.Green };

var area = new ChartArea();
area.AxisX.MajorGrid.LineColor = Color.Transparent;
chart.ChartAreas.Add(area);

var series1 = new Series("Done");
foreach (var item in data1)
{
    series1.Points.AddXY(item.Key, item.Value);
}
series1.MarkerBorderWidth = 1;

var series2 = new Series("In Progress");
foreach (var item in data2)
{
    series2.Points.AddXY(item.Key, item.Value);
}

var series3 = new Series("Needs Review");
foreach (var item in data3)
{
    series3.Points.AddXY(item.Key, item.Value);
}

var series4 = new Series("Goal");
foreach (var item in data4)
{
    series4.Points.AddXY(item.Key, item.Value);
}
series4.ChartType = SeriesChartType.Line;
series4.BorderWidth = 2;

series1.ChartType = series2.ChartType = series3.ChartType = SeriesChartType.StackedColumn;
series1.Font = series2.Font = series3.Font = series4.Font = new Font("Verdana", 8.25f, FontStyle.Regular);

chart.Series.Add(series1);
chart.Series.Add(series2);
chart.Series.Add(series3);
chart.Series.Add(series4);
感谢您的帮助。
更新:
当我继续寻找合适的解决方案时,我仅针对“目标”线系列实现了一个附加图表,其目的是:
- 新图表的某些属性的颜色设置为透明和
- 将此 现有图表上方的图表
此方法通过在条形系列上显示“目标”线系列并允许“目标”线系列延伸到 y 轴来提供正确的表示。但它禁用了现有图表上条形图系列的工具提示和单击操作。由于用户体验不足,这种方法不是合适的解决方案。
寻找解决方案的工作仍在继续……
I have questions about the MS ASP.NET chart control.
- How can a line series be set over a bar series so that it extends to the y-axis of a chart?
- Is it possible to place the name of the line series, i.e. "Goal", to the right of the chart as a replacement to including this series in the legend?
As you can see in the screenshot below, I have a line series presenting on top of a bar series that doesn't extend to the y-axis of the chart.

The code is as follows:
var data1 = new Dictionary<string, float>
{
    { "W1", 80},
    { "W2", 60},
    { "W3", 40},
    { "W4", 20},
    { "W5", 10}
};
var data2 = new Dictionary<string, float>
{
    { "W1", 10},
    { "W2", 10},
    { "W3", 0},
    { "W4", 10},
    { "W5", 10}
};
var data3 = new Dictionary<string, float>
{
    { "W1", 10},
    { "W2", 30},
    { "W3", 50},
    { "W4", 70},
    { "W5", 80}
};
var data4 = new Dictionary<string, float>
{
    { "W1", 50},
    { "W2", 50},
    { "W3", 50},
    { "W4", 50},
    { "W5", 50}
};

var chart = new Chart();
chart.Height = Unit.Pixel(300);
chart.Width = Unit.Pixel(450);
chart.Legends.Add("Legend").Alignment = StringAlignment.Center;
chart.Palette = ChartColorPalette.None;
chart.PaletteCustomColors = new Color[] { Color.FromArgb(191, 214, 151), Color.FromArgb(249, 255, 149), Color.FromArgb(191, 79, 75), Color.Green };

var area = new ChartArea();
area.AxisX.MajorGrid.LineColor = Color.Transparent;
chart.ChartAreas.Add(area);

var series1 = new Series("Done");
foreach (var item in data1)
{
    series1.Points.AddXY(item.Key, item.Value);
}
series1.MarkerBorderWidth = 1;

var series2 = new Series("In Progress");
foreach (var item in data2)
{
    series2.Points.AddXY(item.Key, item.Value);
}

var series3 = new Series("Needs Review");
foreach (var item in data3)
{
    series3.Points.AddXY(item.Key, item.Value);
}

var series4 = new Series("Goal");
foreach (var item in data4)
{
    series4.Points.AddXY(item.Key, item.Value);
}
series4.ChartType = SeriesChartType.Line;
series4.BorderWidth = 2;

series1.ChartType = series2.ChartType = series3.ChartType = SeriesChartType.StackedColumn;
series1.Font = series2.Font = series3.Font = series4.Font = new Font("Verdana", 8.25f, FontStyle.Regular);

chart.Series.Add(series1);
chart.Series.Add(series2);
chart.Series.Add(series3);
chart.Series.Add(series4);
Thanks for the help.
UPDATE:
As I continue to search for an appropriate solution, I implemented an additional chart for just the "Goal" line series with the intentions of:
- Setting the color of certain properties of this new chart to Transparent and
- Laying this chart on top of the existing chart
This approach provided the correct presentation by displaying the "Goal" line series over the bar series and allowing the "Goal" line series to extend to the y-axis. But it disabled the tooltips and the click actions of the bar series on the existing chart. Due to this deficient user experience, this approach isn't a suitable solution.
The search for a solution continues...
如果你对这篇内容有疑问,欢迎到本站社区发帖提问 参与讨论,获取更多帮助,或者扫码二维码加入 Web 技术交流群。

绑定邮箱获取回复消息
由于您还没有绑定你的真实邮箱,如果其他用户或者作者回复了您的评论,将不能在第一时间通知您!

发布评论
评论(1)
对于问题 1:
另一种方法是使用 PostPaint 事件,您可以在图表上的任何位置绘制任何您想要的内容...但您仍然会丢失工具提示和该行的此类交互功能。
对于您的问题2:
您可以从图例项集合中排除不需要的图例条目;您可以自定义图例,就像本示例中所做的那样:
并且,您可以拥有一个仅包含一个标签、一个点等的辅助 Y 轴,或者:您可以使用 PostPaint 事件处理程序来绘制您想要的任何内容。
您可以从 MS 下载一个很棒的可安装示例包:此处。他们展示了许多您可以研究的代码示例。我从这些样本和使用这个新的免费反射器中发现了这些东西:ILSpy。
希望这有帮助。
For question 1:
Another way is to use the PostPaint event, where you can draw anything you wish, anywhere on the chart... but still you lose the tooltips and such interactive features with that line.
For your question 2:
You can exclude the unwanted legend entry from the legend item collection; you can customize legend like it is done this example:
And, you can have a secondary Y axis with only one label, one point, etc. or: you can use the PostPaint event handler to draw anything you wish.
You can download a great installable sample pack from MS: here. They show many code examples which you can study. I found out these things from those samples and from using this new free reflector: ILSpy.
Hope this helps.