了解 FFT 输出
我需要一些帮助来理解 DFT/FFT 计算的输出。
我是一名经验丰富的软件工程师,需要解释一些智能手机加速度计读数,例如查找主要频率。不幸的是,十五年前我在大学的电子工程课程中大部分都在睡觉,但最近几天我一直在阅读 DFT 和 FFT(显然收效甚微)。
请不要回复“去参加EE课程”。如果我的雇主付钱给我的话,我实际上打算这样做。 :)
所以这是我的问题:
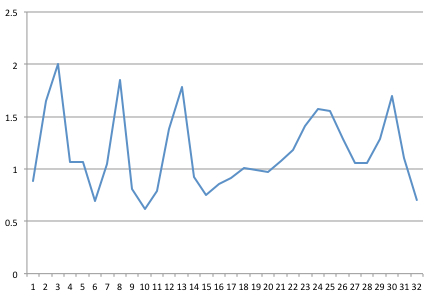
我捕获了 32 Hz 的信号。这是 32 个点的 1 秒样本,我已在 Excel 中绘制了图表。

然后我得到了一些 FFT 代码,来自哥伦比亚大学,用 Java 编写(遵循“Java 中可靠且快速的 FFT")。
该程序的输出如下。我相信它正在运行就地 FFT,因此它为输入和输出重新使用相同的缓冲区。
Before:

Re: [0.887  1.645  2.005  1.069  1.069  0.69  1.046  1.847  0.808  0.617  0.792  1.384  1.782  0.925  0.751  0.858  0.915  1.006  0.985  0.97  1.075  1.183  1.408  1.575  1.556  1.282  1.06  1.061  1.283  1.701  1.101  0.702  ]

Im: [0.0  0.0  0.0  0.0  0.0  0.0  0.0  0.0  0.0  0.0  0.0  0.0  0.0  0.0  0.0  0.0  0.0  0.0  0.0  0.0  0.0  0.0  0.0  0.0  0.0  0.0  0.0  0.0  0.0  0.0  0.0  0.0  ]

After:

Re: [37.054  1.774  -1.075  1.451  -0.653  -0.253  -1.686  -3.602  0.226  0.374  -0.194  -0.312  -1.432  0.429  0.709  -0.085  0.0090  -0.085  0.709  0.429  -1.432  -0.312  -0.194  0.374  0.226  -3.602  -1.686  -0.253  -0.653  1.451  -1.075  1.774  ]

Im: [0.0  1.474  -0.238  -2.026  -0.22  -0.24  -5.009  -1.398  0.416  -1.251  -0.708  -0.713  0.851  1.882  0.379  0.021  0.0  -0.021  -0.379  -1.882  -0.851  0.713  0.708  1.251  -0.416  1.398  5.009  0.24  0.22  2.026  0.238  -1.474  ]
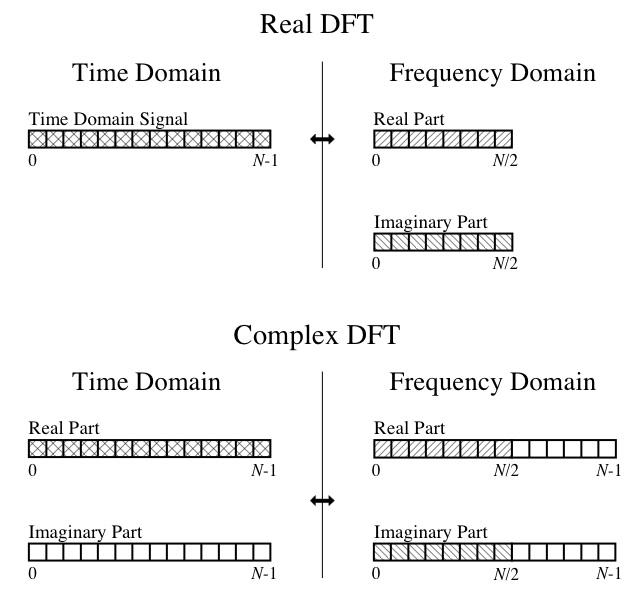
所以,在这一点上,我无法确定输出的正面或反面。我理解 DFT 概念,例如实部是分量余弦波的幅度,虚部是分量正弦波的幅度。我还可以按照伟大的书“科学家和工程师数字信号处理指南”中的图表进行操作: 
所以我的具体问题是:
从 FFT 的输出中,我如何找到“最常出现的频率”?这是我对加速度计数据分析的一部分。我应该读取实数(余弦)数组还是虚数(正弦)数组?
我有一个时域 32 点输入。 FFT 的输出不应该是实数的 16 元素数组和虚数的 16 元素数组吗?为什么程序给我的实数和虚数数组输出的大小都是 32?
与上一个问题相关,如何解析输出数组中的索引?鉴于我以 32 Hz 采样的 32 个样本的输入,我的理解是 16 元素数组输出的索引应均匀分布到采样率(32 Hz)的 1/2,所以我对每个元素的理解是否正确数组的 代表 (32 Hz * 1/2) / 16 = 1 Hz?
为什么FFT输出有负值?我认为这些值代表正弦曲线的幅度。例如,Real[ 3 ] = -1.075 的输出应表示频率为 3 的余弦波的幅度为 -1.075。对吗?幅度怎么可能是负值?
I need some help understanding the output of the DFT/FFT computation.
I'm an experienced software engineer and need to interpret some smartphone accelerometer readings, such as finding the principal frequencies. Unfortunately, I slept through most of my college EE classes fifteen years ago, but I've been reading up on DFT and FFT for the last several days (to little avail, apparently).
Please, no responses of "go take an EE class". I'm actually planning to do that if my employer will pay me. :)
So here is my problem:
I've captured a signal at 32 Hz. Here is a 1 second sample of 32 points, which I've charted in Excel.

I then got some FFT code written in Java from Columbia University (after following the suggestions in a post on "Reliable and fast FFT in Java").
The output of this program is as follows. I believe it is running an in-place FFT, so it re-uses the same buffer for both input and output.
Before:

Re: [0.887  1.645  2.005  1.069  1.069  0.69  1.046  1.847  0.808  0.617  0.792  1.384  1.782  0.925  0.751  0.858  0.915  1.006  0.985  0.97  1.075  1.183  1.408  1.575  1.556  1.282  1.06  1.061  1.283  1.701  1.101  0.702  ]

Im: [0.0  0.0  0.0  0.0  0.0  0.0  0.0  0.0  0.0  0.0  0.0  0.0  0.0  0.0  0.0  0.0  0.0  0.0  0.0  0.0  0.0  0.0  0.0  0.0  0.0  0.0  0.0  0.0  0.0  0.0  0.0  0.0  ]

After:

Re: [37.054  1.774  -1.075  1.451  -0.653  -0.253  -1.686  -3.602  0.226  0.374  -0.194  -0.312  -1.432  0.429  0.709  -0.085  0.0090  -0.085  0.709  0.429  -1.432  -0.312  -0.194  0.374  0.226  -3.602  -1.686  -0.253  -0.653  1.451  -1.075  1.774  ]

Im: [0.0  1.474  -0.238  -2.026  -0.22  -0.24  -5.009  -1.398  0.416  -1.251  -0.708  -0.713  0.851  1.882  0.379  0.021  0.0  -0.021  -0.379  -1.882  -0.851  0.713  0.708  1.251  -0.416  1.398  5.009  0.24  0.22  2.026  0.238  -1.474  ]
So, at this point, I can't make heads or tails of the output. I understand the DFT concepts, such as the real portion being the amplitudes of the component cosine waves and the imaginary portion being the amplitudes of the component sine waves. I can also follow this diagram from the great book "The Scientist and Engineer's Guide to Digital Signal Processing":
So my specific questions are:
From the output of the FFT, how do I find the "most occurring frequencies"? This is part of my analysis of my accelerometer data. Should I read the real (cosine) or imaginary (sine) arrays?
I have a 32-point input in the time domain. Shouldn't the output of the FFT be a 16-element array for reals and a 16-element array for imaginary? Why does the program give me real and imaginary array outputs both of size 32?
Related to the previous question, how do I parse the indexes in the output arrays? Given my input of 32 samples sampled at 32 Hz, my understanding is that a 16-element array output should have its index uniformly spread up to 1/2 the sampling rate (of 32 Hz), so am I correct in understanding that each element of the array represents (32 Hz * 1/2) / 16 = 1 Hz?
Why does the FFT output have negative values? I thought the values represent amplitudes of a sinusoid. For example, the output of Real[ 3 ] = -1.075 should mean an amplitude of -1.075 for a cosine wave of frequency 3. Is that right? How can an amplitude be negative?
如果你对这篇内容有疑问,欢迎到本站社区发帖提问 参与讨论,获取更多帮助,或者扫码二维码加入 Web 技术交流群。

绑定邮箱获取回复消息
由于您还没有绑定你的真实邮箱,如果其他用户或者作者回复了您的评论,将不能在第一时间通知您!

发布评论
评论(4)
您不应该寻找复数的实部或想象部分(即您的实数和虚数数组是什么)。相反,您想要查找定义为 sqrt (real * real + imag * imag) 的频率幅度。这个数字永远是正数。现在您所需要搜索的只是最大值(忽略数组中的第一个条目。这是您的 DC 偏移,并且不包含频率相关信息)。
因为您使用的是复数到复数的 FFT,所以您会得到 32 个实数和 32 个虚数输出。请记住,您已通过使用零虚部对其进行扩展,将 32 个样本转换为 64 个值(或 32 个复数值)。这会产生对称的 FFT 输出,其中频率结果出现两次。一旦准备好在输出 0 到 N/2 中使用,并在输出 N/2 到 N 中镜像后。在您的情况下,最简单的方法是忽略输出 N/2 到 N。您不需要它们,它们是只是关于如何计算 FFT 的一个工件。
fft-bin 的频率方程为 (bin_id * freq/2) / (N/2),其中 freq 是采样频率(又名 32 Hz,N 是 FFT 的大小)。在您的情况下,这简化为每个 bin 1 Hz。 bin N/2 到 N 代表负频率(我知道这是奇怪的概念)。对于您的情况,它们不包含任何重要信息,因为它们只是前 N/2 个频率的镜像。
每个箱的实部和虚部形成一个复数。如果实部和虚部为负,而频率本身的大小为正,也没关系(请参阅我对问题 1 的回答)。我建议您阅读复数。解释它们如何工作(以及为什么它们有用)超出了单个 stackoverflow 问题所能解释的范围。
注意:您可能还想了解什么是自相关,以及如何使用它来查找信号的基频。我有一种感觉,这就是你真正想要的。
You should neither look for the real or imaginative part of a complex number (that what's your real and imaginary array is). Instead you want to look for the magnitude of the frequency which is defined as sqrt (real * real + imag * imag). This number will always be positive. Now all you have to search is for the maximum value (ignore the first entry in your array. That is your DC offset and carries no frequency dependent information).
You get 32 real and 32 imaginary outputs because you are using a complex to complex FFT. Remember that you've converted your 32 samples into 64 values (or 32 complex values) by extending it with zero imaginary parts. This results in a symetric FFT output where the frequency result occurs twice. Once ready to use in the outputs 0 to N/2, and once mirrored in the outputs N/2 to N. In your case it's easiest to simply ignore the outputs N/2 to N. You don't need them, they are just an artifact on how you calculate your FFT.
The frequency to fft-bin equation is (bin_id * freq/2) / (N/2) where freq is your sample-frequency (aka 32 Hz, and N is the size of your FFT). In your case this simplifies to 1 Hz per bin. The bins N/2 to N represent negative frequencies (strange concept, I know). For your case they don't contain any significant information because they are just a mirror of the first N/2 frequencies.
Your real and imaginary parts of each bin form a complex number. It is okay if real and imaginary parts are negative while the magnitude of the frequency itself is positive (see my answer to question 1). I suggest that you read up on complex numbers. Explaining how they work (and why they are useful) exceeds what is possible to explain in a single stackoverflow-question.
Note: You may also want to read up what autocorrelation is, and how it is used to find the fundamental frequency of a signal. I have a feeling that this is what you really want.
您已经有了一些很好的答案,但我只想补充一点,您确实需要应用 窗口函数 在 FFT 之前对时域数据进行处理,否则由于 光谱泄漏。
You already have some good answers, but I'll just add that you really need to apply a window function to your time domain data prior to the FFT, otherwise you will get nasty artefacts in your spectrum, due to spectral leakage.
1) 除了第一个索引(即 DC 分量)之外,查找实数数组中具有最高值的索引。您可能需要远高于 32 Hz 的采样率和更大的窗口大小,才能获得有意义的结果。
2) 两个阵列的后半部分是前半部分的镜像。例如,请注意实数数组的最后一个元素 (1.774) 与第二个元素 (1.774) 相同,而虚数数组的最后一个元素 (1.474) 是第二个元素的负元素。
3) 在 32 Hz 采样率下可以拾取的最大频率为 16 Hz(奈奎斯特限制),所以每一步都是 2 Hz。如前所述,请记住第一个元素是 0 Hz(即直流偏移)。
4) 当然,负振幅是完全合理的。它只是意味着信号被“翻转”——标准 FFT 基于余弦,通常在 t = 0 时值为 1,因此在时间 = 0 时值为 -1 的信号将具有负幅度。
1) Look for the indices in the real array with the highest values, besides the first one (that's the DC component). You'll probably need a sample rate considerably higher than 32 Hz, and a larger window size, to get much in the way of meaningful results.
2) The second half of both arrays is the mirror of the first half. For instance, note that the last element of the real array (1.774) is the same as the second element (1.774), and the last element of the imaginary array (1.474) is the negative of the second element.
3) The maximum frequency you can pick up at a sample rate of 32 Hz is 16 Hz (Nyquist limit), so each step is 2 Hz. As noted earlier, remember that the first element is 0 Hz (i.e, the DC offset).
4) Sure, a negative amplitude makes perfect sense. It just means that the signal is "flipped" -- a standard FFT is based on a cosine, which normally has value = 1 at t = 0, so a signal which had value = -1 at time = 0 would have a negative amplitude.
请注意,“最常出现的频率”可能会分散到多个 FFT 箱中,即使使用窗函数也是如此。因此,您可能必须使用更长的窗口、多个窗口或插值来更好地估计任何频谱峰值的频率。
Note that the "most occurring frequency" can get splattered into multiple FFT bins, even with a window function. So you may have to use a longer window, multiple windows, or interpolation to better estimate the frequency of any spectral peaks.