Python 中的数密度等值线
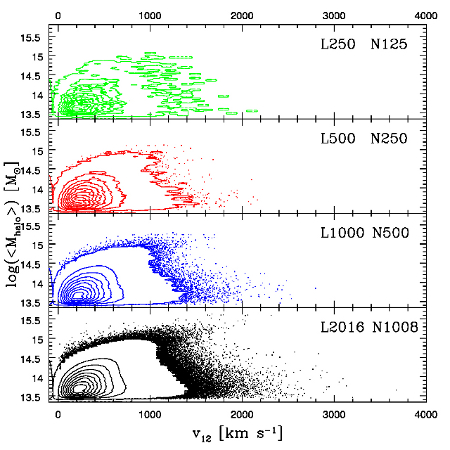
我试图在 python 中重现这个图,但运气不佳:

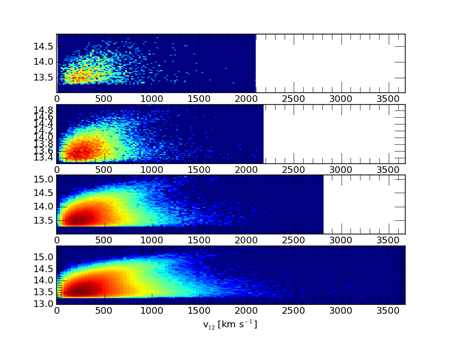
这是当前完成的一个简单的数字密度轮廓在 SuperMongo 中。我想放弃它,转而使用Python,但我能得到的最接近的是:

这是使用 hexbin()。我怎样才能让 python 情节类似于 SuperMongo 情节?我没有足够的代表来发布图片,抱歉链接。感谢您抽出时间!
I'm trying to reproduce this plot in python with little luck:

It's a simple number density contour currently done in SuperMongo. I'd like to drop it in favor of Python but the closest I can get is:

which is by using hexbin(). How could I go about getting the python plot to resemble the SuperMongo one? I don't have enough rep to post images, sorry for the links. Thanks for your time!
如果你对这篇内容有疑问,欢迎到本站社区发帖提问 参与讨论,获取更多帮助,或者扫码二维码加入 Web 技术交流群。

绑定邮箱获取回复消息
由于您还没有绑定你的真实邮箱,如果其他用户或者作者回复了您的评论,将不能在第一时间通知您!

发布评论
评论(4)
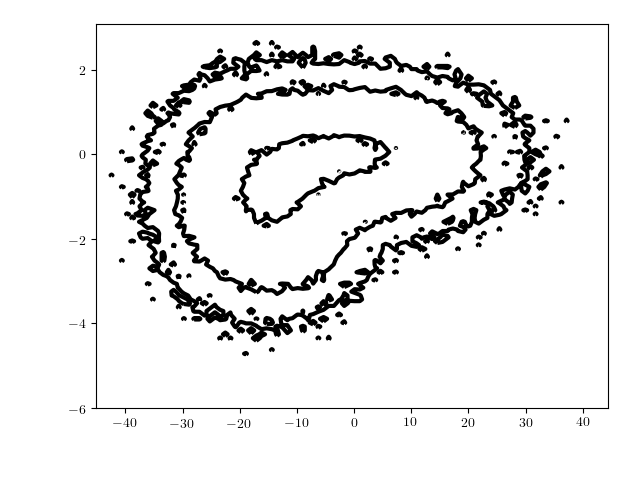
来自 SuperMongo 同事的简单等高线图示例 => python 受苦者:
产生一个漂亮的等高线图。
轮廓函数提供了很多奇特的调整,例如让我们手动设置级别:
生成此图:< img src="https://i.sstatic.net/sMch8.png" alt="调整级别的等高线图">
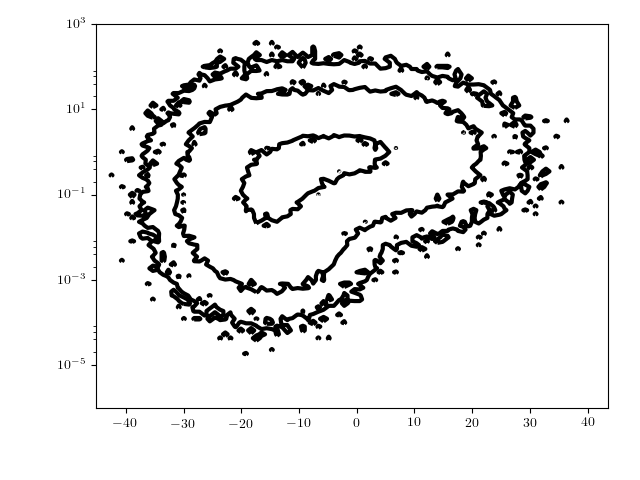
最后,在 SM 中,可以在线性和对数尺度上绘制等高线图,所以我花了一点时间试图弄清楚如何在 matplotlib 中做到这一点。下面是一个示例,其中 y 点需要绘制在对数刻度上,而 x 点仍绘制在线性刻度上:
这会生成一个看起来与线性刻度非常相似的图,但具有一个很好的垂直对数轴,这就是意图:
Example simple contour plot from a fellow SuperMongo => python sufferer:
produces a nice contour plot.
The contour function offers a lot of fancy adjustments, for example let's set the levels by hand:
producing this plot:
And finally, in SM one can do contour plots on linear and log scales, so I spent a little time trying to figure out how to do this in matplotlib. Here is an example when the y points need to be plotted on the log scale and the x points still on the linear scale:
This produces a plot which looks very similar to the linear one, but with a nice vertical log axis, which is what was intended:
您检查过 matplotlib 的等高线图吗?
Have you checked out matplotlib's contour plot?
不幸的是我无法查看你的图片。你的意思是像这个吗?它是由 MathGL —— GPL 绘图库完成的,它也有 Python 接口。您可以使用任意数据数组作为输入(包括 numpy 的数组)。
Unfortunately I couldn't view yours images. Do you mean something like this? It was done by MathGL -- GPL plotting library, which have Python interface too. And you can use arbitrary data arrays as input (including numpy's one).
您可以使用 numpy.histogram2d 来获取数组的数密度分布。
试试这个例子:
http://micropore.wordpress.com/ 2011/10/01/二维密度图或二维直方图/
You can use numpy.histogram2d to get a number density distribution of your array.
Try this example:
http://micropore.wordpress.com/2011/10/01/2d-density-plot-or-2d-histogram/