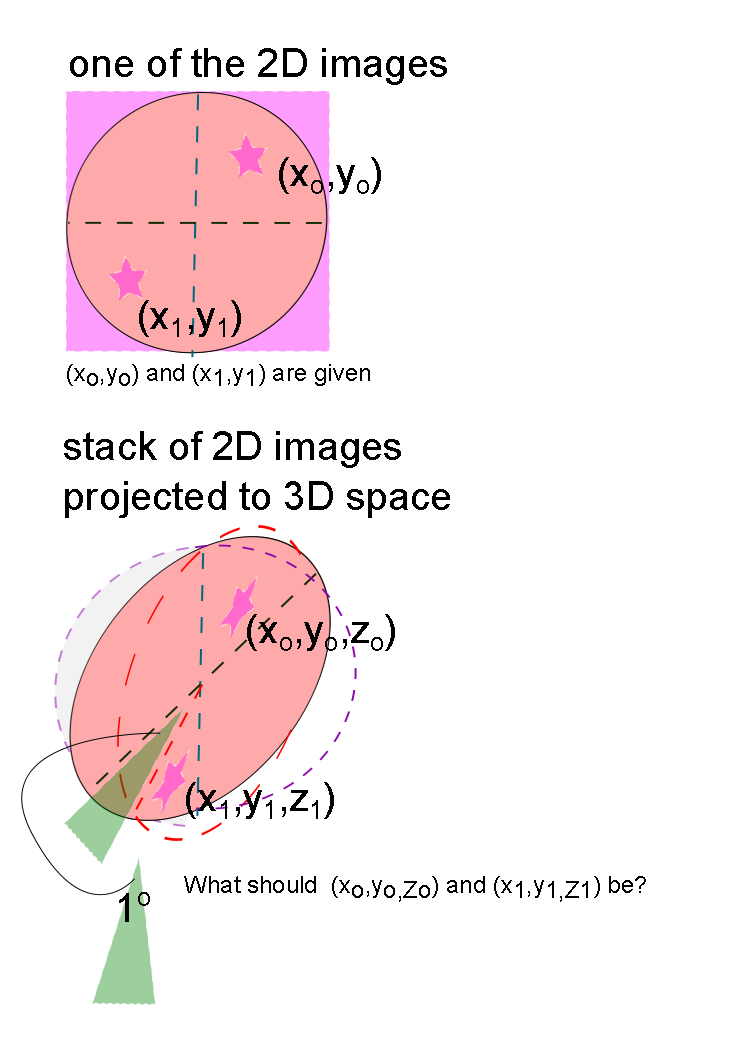
如何将 2D 图像上的点 (x,y) 映射到 3D 空间? (提供插图)
我有一堆图像(大约 180 张),每张图像上都有 2 颗星(只是基本注释)。因此,最初提供了两颗星的位置 (x,y)。所有这些图像的尺寸都是固定且恒定的。
图像之间的“距离”约为 1o,原点为每个 2D 图像的中心(宽度/2,高度/2)。请注意,如果很好地绘制和插值,星星实际上会形成一个不规则形状的环。

红色虚线圆圈和紫色虚线圆圈赋予 3D 空间更强烈的气息以及 2D 图像的排列(如扇子)。它还表明每个切片的间隔约为 1o。
根据提供的 2D 图像中出现的 (x,y),知道每个图像约为 1o,如何在 3D 空间中获得相应的 (x,y,z)
我知道 MATLAB 具有 3D 绘图功能,我应该如何实施上述场景的解决方案? (不幸的是,我对使用 MATLAB 绘制 3D 的经验很少)
解决方案
根据已接受的答案,我进一步查找:球坐标系。根据 phi、rho 和 theta 的计算,我可以毫无问题地重建环。希望这对遇到类似问题的人有所帮助。
我也在这里记录了解决方案。我希望它也能帮助那里的人: http://gray-suit.blogspot.com/2011/ 07/球坐标系.html
I have a stack of images (about 180 of them) and there are 2 stars (just basic annotations) on every single image. Hence, the position (x,y) of the two stars are provided initially. The dimensions of all these images are fixed and constant.
The 'distance' between the image is about 1o with the origin to be the center (width/2, height/2) of every single 2D image. Note that, if this is plotted out and interpolated nicely, the stars would actually form a ring of an irregular shape.

The dotted red circle and dotted purple circle are there to give a stronger scent of a 3D space and the arrangement of the 2D images (like a fan). It also indicates that each slice is about 1o apart.
With the provided (x,y) that appeared in the 2D image, how do you get the corresponding (x,y,z) in the 3d space knowing that each image is about 1o apart?
I know that MATLAB had 3D plotting capabilities, how should I go about implementing the solution to the above scenario? (Unfortunately, I have very little experience plotting 3D with MATLAB)
SOLUTION
Based on the accepted answer, I looked up a bit further: spherical coordinate system. Based on the computation of phi, rho and theta, I could reconstruct the ring without problems. Hopefully this helps anyone with similar problems.
I have also documented the solution here. I hope it helps someone out there, too:
http://gray-suit.blogspot.com/2011/07/spherical-coordinate-system.html
如果你对这篇内容有疑问,欢迎到本站社区发帖提问 参与讨论,获取更多帮助,或者扫码二维码加入 Web 技术交流群。

绑定邮箱获取回复消息
由于您还没有绑定你的真实邮箱,如果其他用户或者作者回复了您的评论,将不能在第一时间通知您!

发布评论
评论(4)
我相信 3D 的 y 坐标保持不变,因此我们可以将其视为将 2D x 和图像角度转换为自上而下查看时的 x 和 z。
2D x 坐标是 3D 空间中距原点的距离(从上到下查看)。图像角度是 3D 空间中点相对于 x 轴所成的角度(自上而下查看)。因此,x 坐标(距原点的距离)和图像角度(自上而下观察的角度)构成了 3D 空间中的 x 和 z 坐标(如果自上而下观察则为 x 和 y)。
这是一个极坐标。
了解如何从极坐标转换为笛卡尔坐标以获得 3D x 和 z 坐标。
我也不擅长数学,这是我的方法:
3D coords = (2Dx * cos(imageangle), 2Dy, 2Dx * sin(imageangle))I believe the y coordinate stays as is for 3D, so we can treat this as converting 2D x and image angle to an x and z when viewed top down.
The 2D x coordinate is the distance from the origin in 3D space (viewed top down). The image angle is the angle the point makes with respect to the x axis in 3D space (viewed top down). So the x coordinate (distance from orign) and the image angle (angle viewed top down) makes up the x and z coordinates in 3D space (or x and y if viewed top down).
That is a polar coordinate.
Read how to convert from polar to cartesian coordinates to get your 3D x and z coordinates.
I'm not great at maths either, here's my go:
3D coords = (2Dx * cos(imageangle), 2Dy, 2Dx * sin(imageangle))给定 2D 坐标 (x,y),只需添加角度 A 作为第三个坐标:(x,y,A)。然后你就有了 3D。
如果您想让注释在 3D 中半径为 r 的圆上移动,您只需计算:
您可以使用 (r*cos(phi),r*sin(phi),0) 在 XY 平面上绘制一个圆,并使用 3x3 旋转矩阵将其旋转到您需要的方向。
Given the 2D coordinates (x,y) just add the angle A as a third coordinate: (x,y,A). Then you have 3D.
If you want to have the Anotations move on a circle of radius r in 3D you can just calculate:
you can use (r*cos(phi),r*sin(phi),0) which draws a circle in the XY-plane and rotate it with a 3x3 rotation matrix into the orientation you need.
从您的问题中不清楚您的旋转是围绕哪个轴进行的。然而,我的答案适用于一般旋转轴。
首先,将您的点放在 3D 空间中,位于 XY 平面上。这意味着这些点的 z 坐标为 0。然后,围绕所需轴应用所需角度的 3D 旋转 - 在您的示例中,这是一度旋转。你可以自己计算变换矩阵(应该不会太难,谷歌“3D旋转矩阵”或类似的关键字)。然而,MATLAB 使用
viewmtx函数使这一切变得更容易,它为您提供 4x4 旋转矩阵。额外(第四个)维度取决于您指定的投影(它的作用类似于缩放系数),但为了简单起见,我将让 MATLAB 使用其默认投影 - 您可以在 MATLAB 文档中阅读相关内容。因此,为了使绘图更清晰,我假设四个点是位于 xy 平面上的正方形的顶点 (
A(1,1),B(1,-1)< /code>、C(-1,-1)、D(1,-1))。It is not clear from you question around which axis your rotation is taking place. However, my answer holds for a general rotation axis.
First, put your points in a 3D space, lying on the X-Y plane. This means the points have a 0 z-coordinate. Then, apply a 3D rotation of the desired angle around the desired axis - in your example, it is a one degree rotation. You could calculate the transformation matrix yourself (should not be too hard, google "3D rotation matrix" or similar keywords). However, MATLAB makes it easier, using the
viewmtxfunction, which gives you a 4x4 rotational matrix. The extra (fourth) dimension is dependent on the projection you specify (it acts like a scaling coefficient), but in order to make things simple, I will let MATLAB use its default projection - you can read about it in MATLAB documentation.So, to make the plot clearer, I assume four points which are the vertices of a square lying on the x-y plane (
A(1,1),B(1,-1),C(-1,-1),D(1,-1)).如果您可以使用模型描述对真实物理系统(如双星系统)的观察,则可以使用粒子滤波器。
这些滤波器的开发目的是在只有一个观察方向可用的情况下定位海上的一艘船。人们跟踪这艘船并估计它的位置和移动速度,跟踪的时间越长,估计就越好。
If you can describe your observation of a real physical system (like a binary star system) with a model, you can use particle filters.
Those filters were developed to locate a ship on the sea, when only one observation direction was available. One tracks the ship and estimates where it is and how fast it moves, the longer one follows, the better the estimates become.