从图中删除轴
是否可以从 pyplot.figure() 中删除轴?
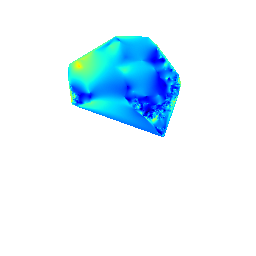
使用 pyplot.imsave() 创建没有轴的图像可以正常
plt.imsave(file, zi)

但它是有限的,因为它只适用于网格数据。
当我使用 pyplot.figure() 并使用 pyplot.savefig() 保存它时,如下所示
...
# create figure
fig = plt.figure(figsize=(1.0,1.0))
# apply contour plot
plt.contour(zi,15,linewidths=0.1,colors='k')
plt.contourf(zi,15,cmap=plt.cm.jet)
# flip the y-axis
ax = plt.gca()
ax.set_ylim(ax.get_ylim()[::-1])
# save to file, 256x256 pixels
plt.savefig(file1, dpi=256)
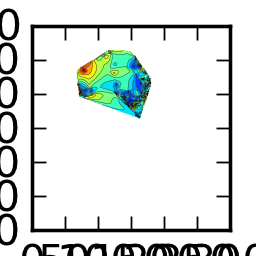
保存的图像保持其轴,如上图所示。
Is it possible to remove the axes from a pyplot.figure()?
Using the pyplot.imsave() to create an image without axes works OK
plt.imsave(file, zi)

but it's limited because it only works with grid data.
When I use pyplot.figure() and save it using pyplot.savefig() as follows
...
# create figure
fig = plt.figure(figsize=(1.0,1.0))
# apply contour plot
plt.contour(zi,15,linewidths=0.1,colors='k')
plt.contourf(zi,15,cmap=plt.cm.jet)
# flip the y-axis
ax = plt.gca()
ax.set_ylim(ax.get_ylim()[::-1])
# save to file, 256x256 pixels
plt.savefig(file1, dpi=256)

the saved image keeps it's axis, as seen on image above.
如果你对这篇内容有疑问,欢迎到本站社区发帖提问 参与讨论,获取更多帮助,或者扫码二维码加入 Web 技术交流群。

绑定邮箱获取回复消息
由于您还没有绑定你的真实邮箱,如果其他用户或者作者回复了您的评论,将不能在第一时间通知您!

发布评论
评论(1)
我能够使用以下代码删除轴显示以及分配给轴的任何间距:
I was able to remove the axis display and any spacing that was allocated to the axis with the following code: