核心图 - 图形的起始原点为 (0,0)

发布于 2024-11-18 07:59:22 字数 265 浏览 2 评论 0原文

如果您看到下图,我想要的是图表在 y 轴上从 0 开始,在 x 轴上从 6/28 开始。我如何使用核心数据来做到这一点?我到处都找不到办法。

每个轴的这两个值都是 0,那么为什么图表不从 0 开始呢?

另外我不想要负值或日期。

我希望它像普通图表一样从一个角落开始。 |_

感谢您的帮助。
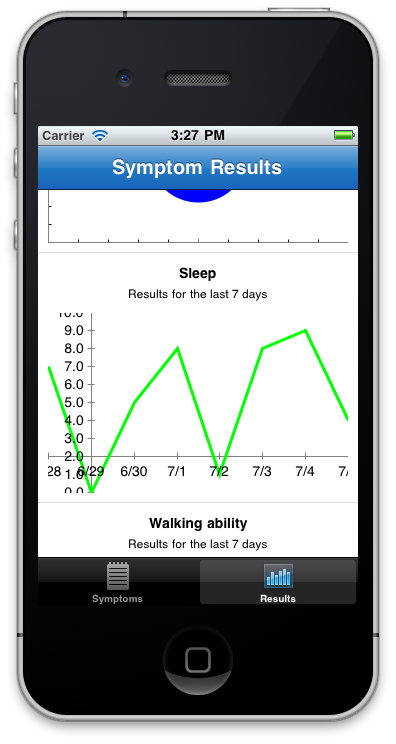
在此处输入图像描述

If you see the picture below, what I want is for the graph to start at 0 on the y axis and 6/28 on the x axis. How can I do this using core data? I can't find a way anywhere.

Both these values are 0 for each axis, so why doesn't the graph start at 0?

Plus I don't want negative values or dates.

I want it to start from a corner, like normal graphs. |_

Thanks for your help.

enter image description here

如果你对这篇内容有疑问,欢迎到本站社区发帖提问 参与讨论,获取更多帮助,或者扫码二维码加入 Web 技术交流群。

扫码二维码加入Web技术交流群

发布评论

需要 登录 才能够评论, 你可以免费 注册 一个本站的账号。

评论(3

蓝眼睛不忧郁 2024-11-25 07:59:22

我不是 CorePlot 方面的专家,但尝试在 x 和 y CPXYAxis 上设置visibleRange 和 gridLinesRange。像这样的东西:

CPXYAxisSet *axisSet = (CPXYAxisSet *)self.axisSet;     // self is of type CPXYGraph

CPXYAxis *x = axisSet.xAxis;
x.visibleRange = [CPPlotRange plotRangeWithLocation:CPDecimalFromFloat(0.0f) length:CPDecimalFromFloat(xMax)];
x.gridLinesRange = [CPPlotRange plotRangeWithLocation:CPDecimalFromFloat(0.0f) length:CPDecimalFromFloat(yMax-1)];

CPXYAxis *y = axisSet.yAxis;
y.visibleRange = [CPPlotRange plotRangeWithLocation:CPDecimalFromFloat(0.0f) length:CPDecimalFromFloat(yMax - 1.0f)];
y.gridLinesRange = [CPPlotRange plotRangeWithLocation:CPDecimalFromFloat(0.0f) length:CPDecimalFromFloat(xMax)];

// Set axes
self.axisSet.axes = [NSArray arrayWithObjects:x, y, nil];

I am not an expert in CorePlot but try setting the visibleRange and gridLinesRange on the x and y CPXYAxis. Something like this:

CPXYAxisSet *axisSet = (CPXYAxisSet *)self.axisSet;     // self is of type CPXYGraph

CPXYAxis *x = axisSet.xAxis;
x.visibleRange = [CPPlotRange plotRangeWithLocation:CPDecimalFromFloat(0.0f) length:CPDecimalFromFloat(xMax)];
x.gridLinesRange = [CPPlotRange plotRangeWithLocation:CPDecimalFromFloat(0.0f) length:CPDecimalFromFloat(yMax-1)];

CPXYAxis *y = axisSet.yAxis;
y.visibleRange = [CPPlotRange plotRangeWithLocation:CPDecimalFromFloat(0.0f) length:CPDecimalFromFloat(yMax - 1.0f)];
y.gridLinesRange = [CPPlotRange plotRangeWithLocation:CPDecimalFromFloat(0.0f) length:CPDecimalFromFloat(xMax)];

// Set axes
self.axisSet.axes = [NSArray arrayWithObjects:x, y, nil];
蘑菇王子 2024-11-25 07:59:22

啊!找到了

你必须设置:

x.orthogonalCoordinateDecimal = CPDecimalFromString(@"0");
y.orthogonalCoordinateDecimal = CPDecimalFromString(@"0");

:)

Ah! found it

You have to set:

x.orthogonalCoordinateDecimal = CPDecimalFromString(@"0");
y.orthogonalCoordinateDecimal = CPDecimalFromString(@"0");

:)

月下伊人醉 2024-11-25 07:59:22

当我正在寻找类似问题的解决方案时。我意识到“CPDecimalFromFloat”是无效的。后来发现 CPDecimalFromFloat 不再存在,但我可以使用“CPTDecimalFromFloat”。

While I am searching for the solution of similar problem. I realise "CPDecimalFromFloat" is invalid . Later on Found out that CPDecimalFromFloat no longer there but I can use "CPTDecimalFromFloat".

~没有更多了~
我们使用 Cookies 和其他技术来定制您的体验包括您的登录状态等。通过阅读我们的 隐私政策 了解更多相关信息。 单击 接受 或继续使用网站,即表示您同意使用 Cookies 和您的相关数据。
原文