Python 相当于 MATLAB 的范数图?
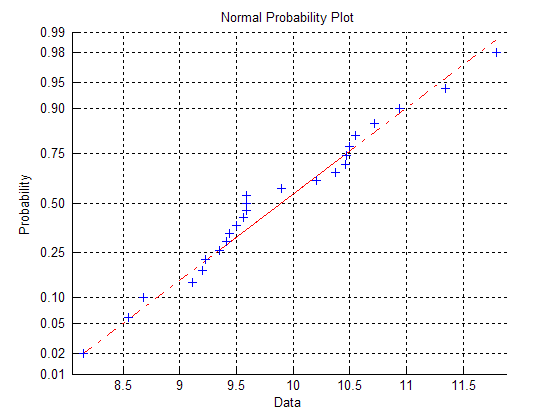
是否有类似于 MATLAB 中的 normplot 的 python 等效函数? 也许在 matplotlib 中?
MATLAB 语法:
x = normrnd(10,1,25,1);
normplot(x)
给出:

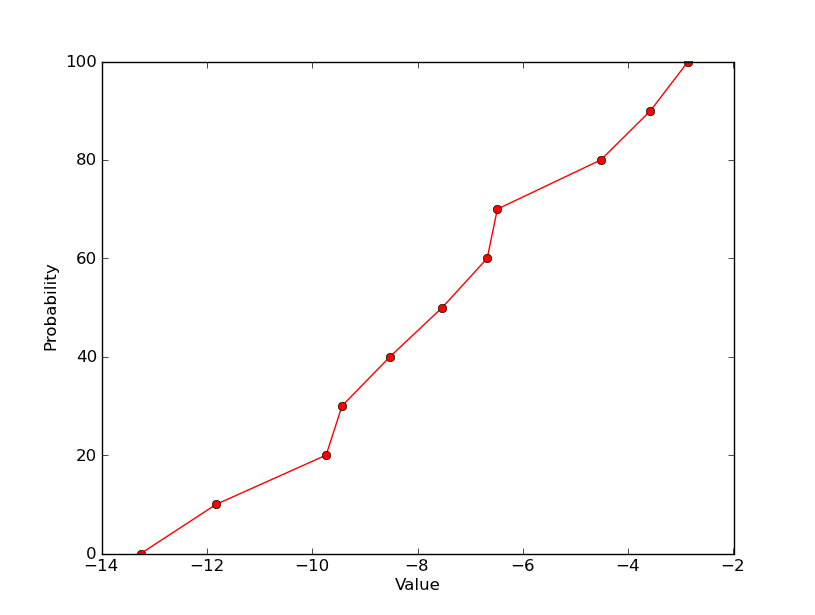
我尝试过使用 matplotlib & numpy 模块来确定数组中值的概率/百分位,但输出图 y 轴刻度与 MATLAB 中的图相比是线性的。
import numpy as np
import matplotlib.pyplot as plt

data =[-11.83,-8.53,-2.86,-6.49,-7.53,-9.74,-9.44,-3.58,-6.68,-13.26,-4.52]
plot_percentiles = range(0, 110, 10)

x = np.percentile(data, plot_percentiles)
plt.plot(x, plot_percentiles, 'ro-')
plt.xlabel('Value')
plt.ylabel('Probability')
plt.show()
给出: 
否则,如何像第一个图中那样调整比例?
谢谢。
Is there a python equivalent function similar to normplot from MATLAB?
Perhaps in matplotlib?
MATLAB syntax:
x = normrnd(10,1,25,1);
normplot(x)
Gives:

I have tried using matplotlib & numpy module to determine the probability/percentile of the values in array but the output plot y-axis scales are linear as compared to the plot from MATLAB.
import numpy as np
import matplotlib.pyplot as plt

data =[-11.83,-8.53,-2.86,-6.49,-7.53,-9.74,-9.44,-3.58,-6.68,-13.26,-4.52]
plot_percentiles = range(0, 110, 10)

x = np.percentile(data, plot_percentiles)
plt.plot(x, plot_percentiles, 'ro-')
plt.xlabel('Value')
plt.ylabel('Probability')
plt.show()
Gives:
Else, how could the scales be adjusted as in the first plot?
Thanks.
如果你对这篇内容有疑问,欢迎到本站社区发帖提问 参与讨论,获取更多帮助,或者扫码二维码加入 Web 技术交流群。

绑定邮箱获取回复消息
由于您还没有绑定你的真实邮箱,如果其他用户或者作者回复了您的评论,将不能在第一时间通知您!

发布评论
评论(4)
答案很晚,但我刚刚遇到了同样的问题并找到了解决方案,值得分享。我猜。
正如乔里斯指出的那样,概率图函数与范数图等效,但所得分布采用累积密度函数的形式。 Scipy.stats 还提供了一个函数来转换这些值。
cdf->百分位
百分位 -> cdf
例如
:要获得等效的 y 轴,如normplot,您可以替换 cdf-ticks:
结果:
A late answer, but I just came across the same problem and found a solution, that is worth sharing. I guess.
As joris pointed out the probplot function is an equivalent to normplot, but the resulting distribution is in form of the cumulative density function. Scipy.stats also offers a function, to convert these values.
cdf -> percentile
percentile -> cdf
for example:
To get an equivalent y-axis, like normplot, you can replace the cdf-ticks:
The result:
我相当确定 matplotlib 不提供这样的东西。
当然,这是可能的,但是您必须重新调整数据并更改 y 轴刻度/标签以匹配,或者,如果您打算经常这样做,也许可以编写一个可以应用的新比例到 matplotlib 轴,如本例所示: http://matplotlib.sourceforge.net/examples/api/custom_scale_example.html。
I'm fairly certain matplotlib doesn't provide anything like this.
It's possible to do, of course, but you'll have to either rescale your data and change your y axis ticks/labels to match, or, if you're planning on doing this often, perhaps code a new scale that can be applied to matplotlib axes, like in this example: http://matplotlib.sourceforge.net/examples/api/custom_scale_example.html.
也许你可以使用 scipy 的 probplot 函数 (
scipy.stats),在我看来,这相当于 MATLAB 标准图:http://docs.scipy.org/doc/scipy /reference/ generated/scipy.stats.probplot.html
但这并不能解决不同 y 轴刻度的问题。
Maybe you can use the
probplotfunction of scipy (scipy.stats), this seems to me an equivalent for MATLABs normplot:http://docs.scipy.org/doc/scipy/reference/generated/scipy.stats.probplot.html
But is does not solve your problem of the different y-axis scale.
使用
matplotlib.semilogy将得到更接近matlab的输出。Using
matplotlib.semilogywill get closer to the matlab output.