Python:Matplotlib - 多个数据集的概率图

发布于 2024-11-15 03:39:40 字数 593 浏览 1 评论 0原文

我有几个数据集(分布)如下:

set1 = [1,2,3,4,5]
set2 = [3,4,5,6,7]
set3 = [1,3,4,5,8]

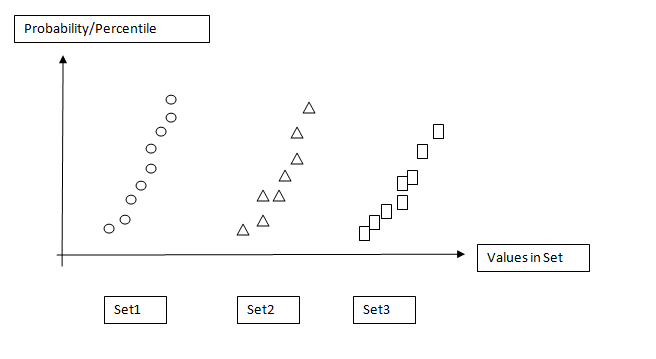
如何使用上面的数据集绘制散点图,其中 y 轴是概率(即集合中分布的百分位数: 0%-100% )和 x -axis 是数据集名称吗? 在 JMP 中,它称为“分位数图”。

像附图一样的东西: 在此处输入图像描述
请赐教。谢谢。

[编辑]

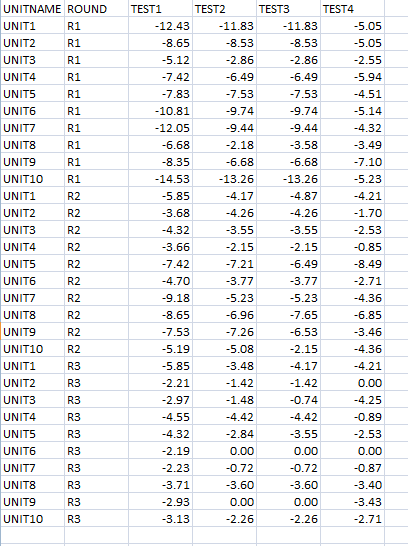
我的数据采用 csv 格式,如下所示:

在此处输入图像描述

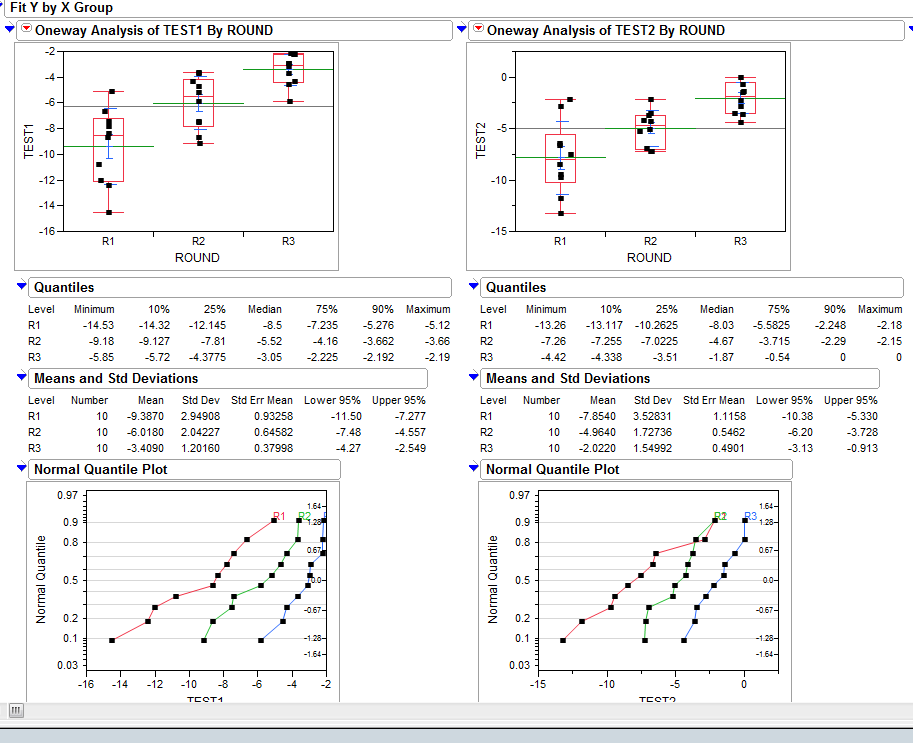
使用 JMP 分析工具,我可以绘制概率分布图(QQ-plot/正态分位数图,如下图所示):

我相信 Joe Kington 几乎已经解决了我的问题,但是我想知道如何将原始 csv 数据处理成概率或百分位数数组。

我这样做是为了在 Python 中自动进行一些统计分析,而不是依赖 JMP 进行绘图。

I have several data sets (distribution) as follows:

set1 = [1,2,3,4,5]
set2 = [3,4,5,6,7]
set3 = [1,3,4,5,8]

How do I plot a scatter plot with the data sets above with the y-axis being the probability (i.e. the percentile of the distribution in set: 0%-100% ) and the x-axis being the data set names?
in JMP, it is called 'Quantile Plot'.

Something like image attached:
enter image description here

Please educate. Thanks.

[EDIT]

My data is in csv as such:
enter image description here

Using JMP analysis tool, I'm able to plot the probability distribution plot (QQ-plot/Normal Quantile Plot as figure far below):
enter image description here

I believe Joe Kington almost has my problem solved but, I'm wondering how to process the raw csv data into arrays of probalility or percentiles.

I doing this to automate some stats analysis in Python rather than depending on JMP for plotting.

如果你对这篇内容有疑问,欢迎到本站社区发帖提问 参与讨论,获取更多帮助,或者扫码二维码加入 Web 技术交流群。

扫码二维码加入Web技术交流群

发布评论

需要 登录 才能够评论, 你可以免费 注册 一个本站的账号。

评论(1

千秋岁 2024-11-22 03:39:40

我不完全清楚你想要什么,所以我会猜测,在这里......

你希望“概率/百分位数”值成为累积直方图?

那么对于一个单一的情节,你会有这样的东西吗? (如上面所示,用标记绘制它,而不是更传统的步骤图...)

import scipy.stats
import numpy as np
import matplotlib.pyplot as plt

# 100 values from a normal distribution with a std of 3 and a mean of 0.5
data = 3.0 * np.random.randn(100) + 0.5

counts, start, dx, _ = scipy.stats.cumfreq(data, numbins=20)
x = np.arange(counts.size) * dx + start

plt.plot(x, counts, 'ro')
plt.xlabel('Value')
plt.ylabel('Cumulative Frequency')

plt.show()

在此处输入图像描述

如果这大致就是您想要的单个绘图,则有多种方法可以在一个图形上绘制多个绘图。最简单的方法就是使用子图。

在这里,我们将生成一些数据集,并将它们绘制在具有不同符号的不同子图上...

import itertools
import scipy.stats
import numpy as np
import matplotlib.pyplot as plt

# Generate some data... (Using a list to hold it so that the datasets don't 
# have to be the same length...)
numdatasets = 4
stds = np.random.randint(1, 10, size=numdatasets)
means = np.random.randint(-5, 5, size=numdatasets)
values = [std * np.random.randn(100) + mean for std, mean in zip(stds, means)]

# Set up several subplots
fig, axes = plt.subplots(nrows=1, ncols=numdatasets, figsize=(12,6))

# Set up some colors and markers to cycle through...
colors = itertools.cycle(['b', 'g', 'r', 'c', 'm', 'y', 'k'])
markers = itertools.cycle(['o', '^', 's', r'$\Phi

在此处输入图像描述

如果我们如果希望它看起来像一个连续的图,我们可以将子图挤压在一起并关闭一些边界。只需在调用 plt.show() 之前添加以下内容

# Because we want this to look like a continuous plot, we need to hide the
# boundaries (a.k.a. "spines") and yticks on most of the subplots
for ax in axes[1:]:
    ax.spines['left'].set_color('none')
    ax.spines['right'].set_color('none')
    ax.yaxis.set_ticks([])
axes[0].spines['right'].set_color('none')

# To reduce clutter, let's leave off the first and last x-ticks.
for ax in axes:
    xticks = ax.get_xticks()
    ax.set_xticks(xticks[1:-1])

# Now, we'll "scrunch" all of the subplots together, so that they look like one
fig.subplots_adjust(wspace=0)

在此处输入图像描述

希望有帮助无论如何,有一点!

编辑:如果您想要百分位值,而不是累积直方图(我真的不应该使用 100 作为样本大小!),这很容易做到。

只需执行以下操作(使用 numpy.percentile 而不是手动标准化事物):

# Replacing the for loop from before...
plot_percentiles = range(0, 110, 10)
for ax, data, color, marker in zip(axes, values, colors, markers):
    x = np.percentile(data, plot_percentiles)
    ax.plot(x, plot_percentiles, color=color, marker=marker, 
            markersize=10, linestyle='none')

, 'h']) # Now let's actually plot our data... for ax, data, color, marker in zip(axes, values, colors, markers): counts, start, dx, _ = scipy.stats.cumfreq(data, numbins=20) x = np.arange(counts.size) * dx + start ax.plot(x, counts, color=color, marker=marker, markersize=10, linestyle='none') # Next we'll set the various labels... axes[0].set_ylabel('Cumulative Frequency') labels = ['This', 'That', 'The Other', 'And Another'] for ax, label in zip(axes, labels): ax.set_xlabel(label) plt.show()

在此处输入图像描述

如果我们如果希望它看起来像一个连续的图,我们可以将子图挤压在一起并关闭一些边界。只需在调用 plt.show() 之前添加以下内容

在此处输入图像描述

希望有帮助无论如何,有一点!

编辑:如果您想要百分位值,而不是累积直方图(我真的不应该使用 100 作为样本大小!),这很容易做到。

只需执行以下操作(使用 numpy.percentile 而不是手动标准化事物):

I'm not entirely clear on what you want, so I'm going to guess, here...

You want the "Probability/Percentile" values to be a cumulative histogram?

So for a single plot, you'd have something like this? (Plotting it with markers as you've shown above, instead of the more traditional step plot...)

import scipy.stats
import numpy as np
import matplotlib.pyplot as plt

# 100 values from a normal distribution with a std of 3 and a mean of 0.5
data = 3.0 * np.random.randn(100) + 0.5

counts, start, dx, _ = scipy.stats.cumfreq(data, numbins=20)
x = np.arange(counts.size) * dx + start

plt.plot(x, counts, 'ro')
plt.xlabel('Value')
plt.ylabel('Cumulative Frequency')

plt.show()

enter image description here

If that's roughly what you want for a single plot, there are multiple ways of making multiple plots on a figure. The easiest is just to use subplots.

Here, we'll generate some datasets and plot them on different subplots with different symbols...

import itertools
import scipy.stats
import numpy as np
import matplotlib.pyplot as plt

# Generate some data... (Using a list to hold it so that the datasets don't 
# have to be the same length...)
numdatasets = 4
stds = np.random.randint(1, 10, size=numdatasets)
means = np.random.randint(-5, 5, size=numdatasets)
values = [std * np.random.randn(100) + mean for std, mean in zip(stds, means)]

# Set up several subplots
fig, axes = plt.subplots(nrows=1, ncols=numdatasets, figsize=(12,6))

# Set up some colors and markers to cycle through...
colors = itertools.cycle(['b', 'g', 'r', 'c', 'm', 'y', 'k'])
markers = itertools.cycle(['o', '^', 's', r'$\Phi

enter image description here

If we want this to look like one continuous plot, we can just squeeze the subplots together and turn off some of the boundaries. Just add the following in before calling plt.show()

# Because we want this to look like a continuous plot, we need to hide the
# boundaries (a.k.a. "spines") and yticks on most of the subplots
for ax in axes[1:]:
    ax.spines['left'].set_color('none')
    ax.spines['right'].set_color('none')
    ax.yaxis.set_ticks([])
axes[0].spines['right'].set_color('none')

# To reduce clutter, let's leave off the first and last x-ticks.
for ax in axes:
    xticks = ax.get_xticks()
    ax.set_xticks(xticks[1:-1])

# Now, we'll "scrunch" all of the subplots together, so that they look like one
fig.subplots_adjust(wspace=0)

enter image description here

Hopefully that helps a bit, at any rate!

Edit: If you want percentile values, instead a cumulative histogram (I really shouldn't have used 100 as the sample size!), it's easy to do.

Just do something like this (using numpy.percentile instead of normalizing things by hand):

# Replacing the for loop from before...
plot_percentiles = range(0, 110, 10)
for ax, data, color, marker in zip(axes, values, colors, markers):
    x = np.percentile(data, plot_percentiles)
    ax.plot(x, plot_percentiles, color=color, marker=marker, 
            markersize=10, linestyle='none')

enter image description here

, 'h']) # Now let's actually plot our data... for ax, data, color, marker in zip(axes, values, colors, markers): counts, start, dx, _ = scipy.stats.cumfreq(data, numbins=20) x = np.arange(counts.size) * dx + start ax.plot(x, counts, color=color, marker=marker, markersize=10, linestyle='none') # Next we'll set the various labels... axes[0].set_ylabel('Cumulative Frequency') labels = ['This', 'That', 'The Other', 'And Another'] for ax, label in zip(axes, labels): ax.set_xlabel(label) plt.show()

enter image description here

If we want this to look like one continuous plot, we can just squeeze the subplots together and turn off some of the boundaries. Just add the following in before calling plt.show()

enter image description here

Hopefully that helps a bit, at any rate!

Edit: If you want percentile values, instead a cumulative histogram (I really shouldn't have used 100 as the sample size!), it's easy to do.

Just do something like this (using numpy.percentile instead of normalizing things by hand):

enter image description here

~没有更多了~
我们使用 Cookies 和其他技术来定制您的体验包括您的登录状态等。通过阅读我们的 隐私政策 了解更多相关信息。 单击 接受 或继续使用网站,即表示您同意使用 Cookies 和您的相关数据。
原文