R ggplot2 - 帮助复制火车图
问题
有人可以帮助我了解解决此问题的一般方法吗?
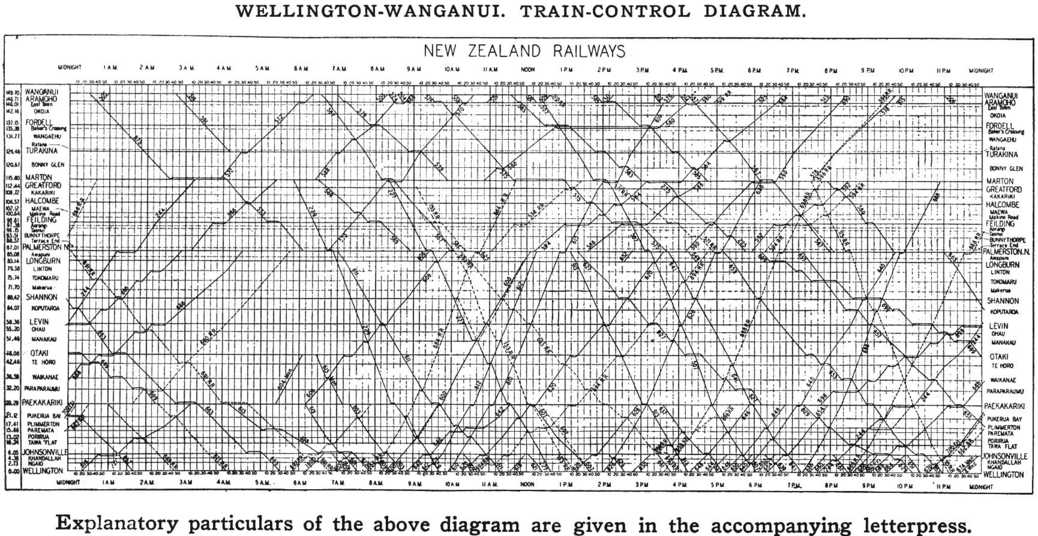
我正在尝试复制像这样的火车图(全尺寸)使用我自己的一些列车运行数据。

该图看起来包括...
- 横轴:时间
- 纵轴:位置
- 线:描绘路径个别列车的
- 颜色:未在黑白图像中显示,但列车应单独着色
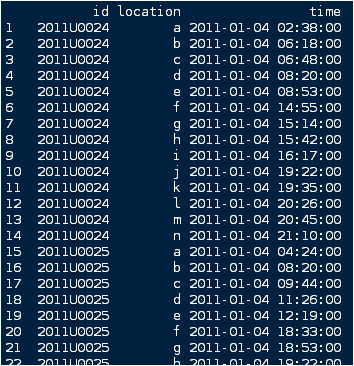
我的数据如下所示...

感谢您的帮助:)
可以像这样复制示例...
dat <- structure(list(id = structure(c(1L, 1L, 1L, 1L, 1L, 1L, 1L, 1L,
1L, 1L, 1L, 1L, 1L, 1L, 2L, 2L, 2L, 2L, 2L, 2L, 2L, 2L, 2L, 2L,
2L, 2L, 2L, 2L, 3L, 3L, 3L, 3L, 3L, 3L, 3L, 3L, 3L, 3L, 3L, 3L,
3L, 3L, 4L, 4L, 4L, 4L, 4L, 4L, 4L, 4L, 4L, 4L, 4L, 4L, 4L, 4L,
5L, 5L, 5L, 5L, 5L, 5L, 5L, 5L, 5L, 5L, 5L, 5L, 5L, 5L, 6L, 6L,
6L, 6L, 6L, 6L, 6L, 6L, 6L, 6L, 6L, 6L, 6L, 6L, 7L, 7L, 7L, 7L,
7L, 7L, 7L, 7L, 7L, 7L, 7L, 7L, 7L, 7L, 8L, 8L, 8L, 8L, 8L, 8L,
8L, 8L, 8L, 8L, 8L, 8L, 8L, 8L, 9L, 9L, 9L, 9L, 9L, 9L, 9L, 9L,
9L, 9L, 9L, 9L, 9L, 9L, 10L, 10L, 10L, 10L, 10L, 10L, 10L, 10L,
10L, 10L, 10L, 10L, 10L, 10L), .Label = c("2011U0024", "2011U0025",
"2011U0026", "2011U0035", "2011U0039", "2011U0040", "2011U0041",
"2011U0046", "2011U0047", "2011U0049"), class = "factor"), location = structure(c(1L,
2L, 3L, 4L, 5L, 6L, 7L, 8L, 9L, 10L, 11L, 12L, 13L, 14L, 1L,
2L, 3L, 4L, 5L, 6L, 7L, 8L, 9L, 10L, 11L, 12L, 13L, 14L, 1L,
2L, 3L, 4L, 5L, 6L, 7L, 8L, 9L, 10L, 11L, 12L, 13L, 14L, 1L,
2L, 3L, 4L, 5L, 6L, 7L, 8L, 9L, 10L, 11L, 12L, 13L, 14L, 1L,
2L, 3L, 4L, 5L, 6L, 7L, 8L, 9L, 10L, 11L, 12L, 13L, 14L, 1L,
2L, 3L, 4L, 5L, 6L, 7L, 8L, 9L, 10L, 11L, 12L, 13L, 14L, 1L,
2L, 3L, 4L, 5L, 6L, 7L, 8L, 9L, 10L, 11L, 12L, 13L, 14L, 1L,
2L, 3L, 4L, 5L, 6L, 7L, 8L, 9L, 10L, 11L, 12L, 13L, 14L, 1L,
2L, 3L, 4L, 5L, 6L, 7L, 8L, 9L, 10L, 11L, 12L, 13L, 14L, 1L,
2L, 3L, 4L, 5L, 6L, 7L, 8L, 9L, 10L, 11L, 12L, 13L, 14L), .Label = c("a",
"b", "c", "d", "e", "f", "g", "h", "i", "j", "k", "l", "m", "n"
), class = "factor"), time = structure(c(1294079880, 1294093080,
1294094880, 1294100400, 1294102380, 1294124100, 1294125240, 1294126920,
1294129020, 1294140120, 1294140900, 1294143960, 1294145100, 1294146600,
1294086240, 1294100400, 1294105440, 1294111560, 1294114740, 1294137180,
1294138380, 1294140120, 1294141320, 1294152420, 1294158000, 1294158900,
1294160100, 1294162200, 1294100700, 1294113180, 1294115220, 1294120980,
1294134780, 1294153920, 1294155060, 1294156680, 1294158480, 1294169460,
1294170420, 1294171020, 1294171200, 1294173900, 1294290660, 1294307040,
1294308720, 1294313880, 1294315860, 1294342200, 1294344600, 1294345080,
1294347180, 1294358400, 1294360200, 1294360440, 1294360800, 1294364100,
1294348860, 1294361400, 1294363500, 1294369560, 1294379160, 1294405080,
1294407240, 1294407900, 1294409940, 1294421040, 1294421400, 1294421880,
1294423200, 1294425240, 1294364100, 1294378200, 1294380180, 1294385700,
1294388220, 1294414500, 1294416600, 1294421040, 1294422720, 1294434720,
1294435500, 1294435920, 1294436400, 1294438920, 1294384440, 1294399440,
1294401120, 1294406520, 1294408800, 1294429560, 1294431960, 1294434720,
1294435980, 1294448160, 1294448340, 1294449360, 1294451400, 1294453500,
1294468860, 1294502640, 1294504020, 1294509360, 1294514520, 1294537980,
1294541400, 1294543920, 1294544640, 1294555860, 1294556520, 1294557120,
1294558200, 1294564860, 1294501680, 1294513560, 1294515300, 1294521120,
1294523820, 1294545960, 1294548780, 1294556820, 1294557420, 1294571580,
1294572000, 1294572420, 1294575600, 1294579500, 1294549080, 1294562460,
1294566300, 1294572180, 1294575420, 1294602180, 1294604520, 1294605300,
1294606020, 1294617060, 1294620540, 1294620720, 1294624800, 1294630080
), class = c("POSIXct", "POSIXt"), tzone = "")), .Names = c("id",
"location", "time"), row.names = c(NA, -140L), class = "data.frame")
QUESTION
Can someone help walk me through the general approach to solving this problem?
I'm trying to replicate a Train Diagram like this one (full size) using some train movement data of my own.

The graph looks to consist of...
- Horizontal Axis: Time
- Vertical Axis: Location
- Lines: Delineate the path of individual trains
- Colours: Not shown in the B&W image, but trains should be coloured separately
And my data looks like this...

Thanks for the help :)
Sample can be reproduced like so...
dat <- structure(list(id = structure(c(1L, 1L, 1L, 1L, 1L, 1L, 1L, 1L,
1L, 1L, 1L, 1L, 1L, 1L, 2L, 2L, 2L, 2L, 2L, 2L, 2L, 2L, 2L, 2L,
2L, 2L, 2L, 2L, 3L, 3L, 3L, 3L, 3L, 3L, 3L, 3L, 3L, 3L, 3L, 3L,
3L, 3L, 4L, 4L, 4L, 4L, 4L, 4L, 4L, 4L, 4L, 4L, 4L, 4L, 4L, 4L,
5L, 5L, 5L, 5L, 5L, 5L, 5L, 5L, 5L, 5L, 5L, 5L, 5L, 5L, 6L, 6L,
6L, 6L, 6L, 6L, 6L, 6L, 6L, 6L, 6L, 6L, 6L, 6L, 7L, 7L, 7L, 7L,
7L, 7L, 7L, 7L, 7L, 7L, 7L, 7L, 7L, 7L, 8L, 8L, 8L, 8L, 8L, 8L,
8L, 8L, 8L, 8L, 8L, 8L, 8L, 8L, 9L, 9L, 9L, 9L, 9L, 9L, 9L, 9L,
9L, 9L, 9L, 9L, 9L, 9L, 10L, 10L, 10L, 10L, 10L, 10L, 10L, 10L,
10L, 10L, 10L, 10L, 10L, 10L), .Label = c("2011U0024", "2011U0025",
"2011U0026", "2011U0035", "2011U0039", "2011U0040", "2011U0041",
"2011U0046", "2011U0047", "2011U0049"), class = "factor"), location = structure(c(1L,
2L, 3L, 4L, 5L, 6L, 7L, 8L, 9L, 10L, 11L, 12L, 13L, 14L, 1L,
2L, 3L, 4L, 5L, 6L, 7L, 8L, 9L, 10L, 11L, 12L, 13L, 14L, 1L,
2L, 3L, 4L, 5L, 6L, 7L, 8L, 9L, 10L, 11L, 12L, 13L, 14L, 1L,
2L, 3L, 4L, 5L, 6L, 7L, 8L, 9L, 10L, 11L, 12L, 13L, 14L, 1L,
2L, 3L, 4L, 5L, 6L, 7L, 8L, 9L, 10L, 11L, 12L, 13L, 14L, 1L,
2L, 3L, 4L, 5L, 6L, 7L, 8L, 9L, 10L, 11L, 12L, 13L, 14L, 1L,
2L, 3L, 4L, 5L, 6L, 7L, 8L, 9L, 10L, 11L, 12L, 13L, 14L, 1L,
2L, 3L, 4L, 5L, 6L, 7L, 8L, 9L, 10L, 11L, 12L, 13L, 14L, 1L,
2L, 3L, 4L, 5L, 6L, 7L, 8L, 9L, 10L, 11L, 12L, 13L, 14L, 1L,
2L, 3L, 4L, 5L, 6L, 7L, 8L, 9L, 10L, 11L, 12L, 13L, 14L), .Label = c("a",
"b", "c", "d", "e", "f", "g", "h", "i", "j", "k", "l", "m", "n"
), class = "factor"), time = structure(c(1294079880, 1294093080,
1294094880, 1294100400, 1294102380, 1294124100, 1294125240, 1294126920,
1294129020, 1294140120, 1294140900, 1294143960, 1294145100, 1294146600,
1294086240, 1294100400, 1294105440, 1294111560, 1294114740, 1294137180,
1294138380, 1294140120, 1294141320, 1294152420, 1294158000, 1294158900,
1294160100, 1294162200, 1294100700, 1294113180, 1294115220, 1294120980,
1294134780, 1294153920, 1294155060, 1294156680, 1294158480, 1294169460,
1294170420, 1294171020, 1294171200, 1294173900, 1294290660, 1294307040,
1294308720, 1294313880, 1294315860, 1294342200, 1294344600, 1294345080,
1294347180, 1294358400, 1294360200, 1294360440, 1294360800, 1294364100,
1294348860, 1294361400, 1294363500, 1294369560, 1294379160, 1294405080,
1294407240, 1294407900, 1294409940, 1294421040, 1294421400, 1294421880,
1294423200, 1294425240, 1294364100, 1294378200, 1294380180, 1294385700,
1294388220, 1294414500, 1294416600, 1294421040, 1294422720, 1294434720,
1294435500, 1294435920, 1294436400, 1294438920, 1294384440, 1294399440,
1294401120, 1294406520, 1294408800, 1294429560, 1294431960, 1294434720,
1294435980, 1294448160, 1294448340, 1294449360, 1294451400, 1294453500,
1294468860, 1294502640, 1294504020, 1294509360, 1294514520, 1294537980,
1294541400, 1294543920, 1294544640, 1294555860, 1294556520, 1294557120,
1294558200, 1294564860, 1294501680, 1294513560, 1294515300, 1294521120,
1294523820, 1294545960, 1294548780, 1294556820, 1294557420, 1294571580,
1294572000, 1294572420, 1294575600, 1294579500, 1294549080, 1294562460,
1294566300, 1294572180, 1294575420, 1294602180, 1294604520, 1294605300,
1294606020, 1294617060, 1294620540, 1294620720, 1294624800, 1294630080
), class = c("POSIXct", "POSIXt"), tzone = "")), .Names = c("id",
"location", "time"), row.names = c(NA, -140L), class = "data.frame")
如果你对这篇内容有疑问,欢迎到本站社区发帖提问 参与讨论,获取更多帮助,或者扫码二维码加入 Web 技术交流群。

绑定邮箱获取回复消息
由于您还没有绑定你的真实邮箱,如果其他用户或者作者回复了您的评论,将不能在第一时间通知您!

发布评论
评论(1)
在 ggplot 中它相当简单。一行代码就足够了:
It is rather straight-forward in
ggplot. A single line of code suffices: