如何在Java中绘制二维图形?

发布于 2024-11-10 07:25:21 字数 556 浏览 2 评论 0 原文

我有两个不同的清单。它们每个都包含 x 和 y 值对(它们都有正值和负值)。如何在 2D 轴上绘制它们?我想为每个值添加点,第一个列表为蓝色,第二个列表为红色。

我的列表类型:

List<List<Double>>

List<Double> inside of List<...> has 2 variables, first of it for x value and the second one is for y value.

然而,我只需要如何在 Java(桌面应用程序)中绘制二维图形并将点放在我想要的任何地方,改进变量的代码就不那么重要了。

PS:

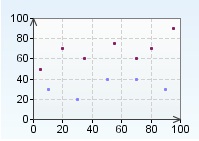
我想要这种图形的越来越简单在此处输入图像描述

类似:

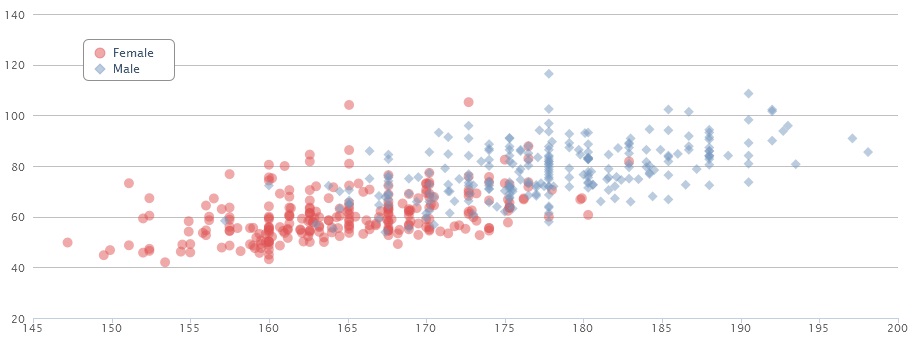
在此输入图像描述

I have 2 different lists. Each of them holds x and y value pairs(they have both positive and negative values). How can I draw them on a 2D axis? I want to put points for every value and they will blue for first list and red for second list.

My lists' type:

List<List<Double>>

List<Double> inside of List<...> has 2 variables, first of it for x value and the second one is for y value.

However just I need to how to draw a two dimensional graphic at Java(desktop application) and put points wherever I want, improving code for my variables is less important.

PS:

I want the more and more simple of that kind of graphic:
enter image description here

Something like:

enter image description here

如果你对这篇内容有疑问,欢迎到本站社区发帖提问 参与讨论,获取更多帮助,或者扫码二维码加入 Web 技术交流群。

扫码二维码加入Web技术交流群

发布评论

需要 登录 才能够评论, 你可以免费 注册 一个本站的账号。

评论(3

陪你搞怪i 2024-11-17 07:25:21

您可以使用像 http://www.jfree.org/jfreechart/ (LGPL-License)网络上有很多示例,而且非常易于使用。

这是一个似乎符合您要求的示例:

http://www.java2s。 com/Code/Java/Chart/JFreeChartMarkerDemo1.htm

you could use a library like http://www.jfree.org/jfreechart/ (LGPL-License) there are lots of examples around the web, and it's quite easy to use.

here's an example, that seems to match your requirements:

http://www.java2s.com/Code/Java/Chart/JFreeChartMarkerDemo1.htm

删除→记忆 2024-11-17 07:25:21

假设您正在使用带有面板的 Swing,则可以使用以下内容:

public class JImagePanelExample extends JPanel {

    private BufferedImage image;
    private Graphics2D drawingBoard;
    private int x, y; // Image position in the panel

    // Let's assume image is a chart and you need to draw lines
    public JImagePanelExample(BufferedImage image, int x, int y) {

        super();
        this.image = image;

        // Retrieving a mean to draw lines
        drawingBoard = image.createGraphics();

        // Draw what you need to draw (see other methods too)
        drawingBoard.drawLine(0, 10, 35, 55);

    }

    // Called by Swing to draw the image in the panel
    @Override
    protected void paintComponent(Graphics g) {
        super.paintComponent(g);
        g.drawImage(image, x, y, null);
    }

}

如果您不想使用 Swing 并且只需要以 2D 进行绘制,请重点关注 BufferedImageGraphics2D仅。

Assuming you are using Swing with a panel, you can use the following:

public class JImagePanelExample extends JPanel {

    private BufferedImage image;
    private Graphics2D drawingBoard;
    private int x, y; // Image position in the panel

    // Let's assume image is a chart and you need to draw lines
    public JImagePanelExample(BufferedImage image, int x, int y) {

        super();
        this.image = image;

        // Retrieving a mean to draw lines
        drawingBoard = image.createGraphics();

        // Draw what you need to draw (see other methods too)
        drawingBoard.drawLine(0, 10, 35, 55);

    }

    // Called by Swing to draw the image in the panel
    @Override
    protected void paintComponent(Graphics g) {
        super.paintComponent(g);
        g.drawImage(image, x, y, null);
    }

}

If you don't want to use Swing and you just need to draw in 2D, focus on BufferedImage and Graphics2D only.

浅唱ヾ落雨殇 2024-11-17 07:25:21

有一个 Java 2D API: http://java.sun.com/products/java -media/2D/ 和许多图表库可以通过网络搜索轻松找到。

There is a Java 2D API: http://java.sun.com/products/java-media/2D/ and many charting libraries easily found with a web search.

~没有更多了~
我们使用 Cookies 和其他技术来定制您的体验包括您的登录状态等。通过阅读我们的 隐私政策 了解更多相关信息。 单击 接受 或继续使用网站,即表示您同意使用 Cookies 和您的相关数据。
原文