将 10 周期曲线压缩为 4 周期
下面我有一个 10 期成本曲线表。我如何以编程方式将其折叠/压缩/缩小为 4 个周期。我正在使用 VBA,但我应该能够理解其他语言。无论你经历什么时期,这个例程都应该有效。例如,如果我传递 7,它应该将百分比压缩为 7 个周期。如果我通过 24,则将百分比扩展到 24 个周期,根据原始曲线扩展百分比。任何帮助或例子将不胜感激。谢谢...
ORIGINAL
Period  Pct
1       10.60%
2       19.00%
3       18.30%
4       14.50%
5       10.70%
6        8.90%
7        6.50%
8        3.10%
9        3.00%
10       5.40%
COLLAPSED
Period  Pct
1       38.75%
2       34.35%
3       16.95%
4        9.95%
编辑:我已经在下面添加了到目前为止我所拥有的示例代码。它仅适用于周期 1、2、3、5、9、10。也许有人可以帮助修改它以适用于任何周期。免责声明,我不是程序员,所以我的编码很糟糕。另外,我不知道我在做什么。
Sub Collapse_Periods()
    Dim aPct As Variant
    Dim aPer As Variant
    aPct = Array(0.106, 0.19, 0.183, 0.145, 0.107, 0.089, 0.065, 0.031, 0.03, 0.054)
    aPer = Array(1, 2, 3, 5, 9, 10)
    For i = 0 To UBound(aPer)
        pm = 10 / aPer(i)
        pct1 = 1
        p = 0
        ttl = 0
        For j = 1 To aPer(i)
            pct = 0
            k = 1
            Do While k <= pm
                pct = pct + aPct(p) * pct1
                pct1 = 1
                p = p + 1
                If k <> pm And k = Int(pm) Then
                    pct1 = (pm - Int(pm)) * j
                    pct = pct + (pct1 * aPct(p))
                    pct1 = 1 - pct1
                End If
                k = k + 1
            Loop
            Debug.Print aPer(i) & " : " & j & " : " & pct
            ttl = ttl + pct
        Next j
        Debug.Print "Total:  " & ttl
    Next i
End Sub
I have a 10 period cost curve table below. How do I programmatically collapse/condense/shrink this to 4 periods. I'm using VBA but I should be able to follow other languages. The routine should work for whatever period you pass to it. For example, if I pass it a 7 it should condense the percentages to 7 periods. If I pass it 24 then expand the percentages to 24 periods, spreading the percentages based on the original curve. Any help or example will be appreciated. Thanks...
ORIGINAL
Period  Pct
1       10.60%
2       19.00%
3       18.30%
4       14.50%
5       10.70%
6        8.90%
7        6.50%
8        3.10%
9        3.00%
10       5.40%
COLLAPSED
Period  Pct
1       38.75%
2       34.35%
3       16.95%
4        9.95%
EDITED: I've added sample code below as to what I have so far. It only works for periods 1, 2, 3, 5, 9, 10. Maybe someone can help modify it to work for any period. Disclaimer, I'm not a programmer so my coding is bad. Plus, I have no clue as to what I'm doing.
Sub Collapse_Periods()
    Dim aPct As Variant
    Dim aPer As Variant
    aPct = Array(0.106, 0.19, 0.183, 0.145, 0.107, 0.089, 0.065, 0.031, 0.03, 0.054)
    aPer = Array(1, 2, 3, 5, 9, 10)
    For i = 0 To UBound(aPer)
        pm = 10 / aPer(i)
        pct1 = 1
        p = 0
        ttl = 0
        For j = 1 To aPer(i)
            pct = 0
            k = 1
            Do While k <= pm
                pct = pct + aPct(p) * pct1
                pct1 = 1
                p = p + 1
                If k <> pm And k = Int(pm) Then
                    pct1 = (pm - Int(pm)) * j
                    pct = pct + (pct1 * aPct(p))
                    pct1 = 1 - pct1
                End If
                k = k + 1
            Loop
            Debug.Print aPer(i) & " : " & j & " : " & pct
            ttl = ttl + pct
        Next j
        Debug.Print "Total:  " & ttl
    Next i
End Sub
如果你对这篇内容有疑问,欢迎到本站社区发帖提问 参与讨论,获取更多帮助,或者扫码二维码加入 Web 技术交流群。

绑定邮箱获取回复消息
由于您还没有绑定你的真实邮箱,如果其他用户或者作者回复了您的评论,将不能在第一时间通知您!

发布评论
评论(2)
我想知道如何使用 Integral 来完成此操作?这就是我所做的 - 也许这是一种繁琐/冗长的方法,但我希望看到一些更好的建议。
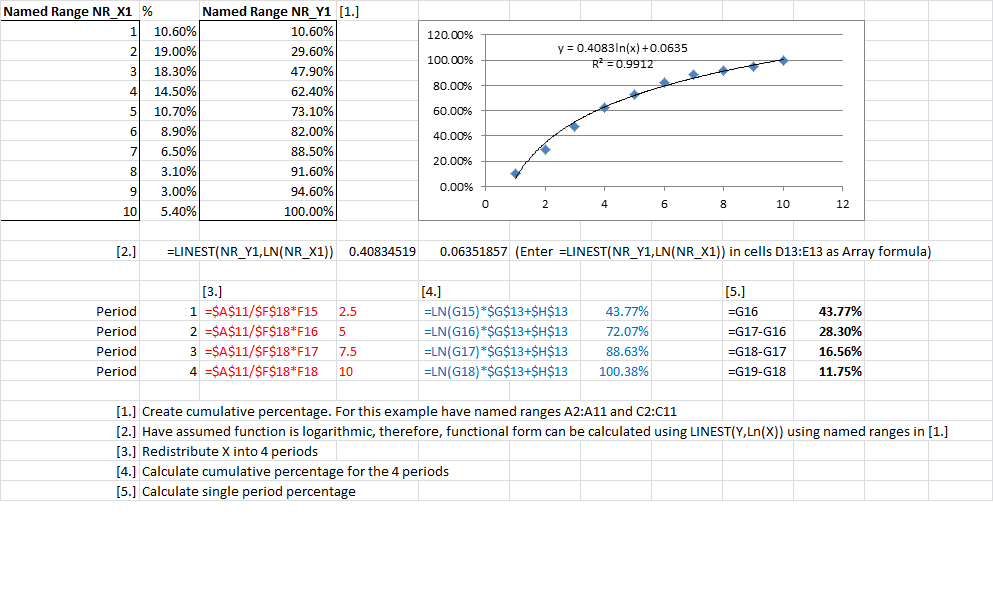
首先使用 LINEST 函数和命名范围在 Excel 中查看该方法可能更容易。我假设该函数是对数的。我已经概述了步骤 [1.] - [5.]

然后,此 VBA 代码本质上复制了 Excel 方法,使用函数传递 2 个数组、句点和一个返回数组可以写入范围
编辑:
此 VBA 代码现在计算新周期减少两侧点的线性趋势。数据以名为 returnArray 的二维数组返回
。 返回:
COLLAPSED
1 38.75%
2 34.35%
3 16.95%
4 9.95%
I would like to know how this is done also using an Integral? This is how I would have done it - perhaps it's a longhand/longwinded method but I'd like to see some better suggestions.
It's probably easier to see the method in Excel first using the LINEST function and Named ranges. I've assumed the function is logarithmic. I've outlined steps [1.] - [5.]

This VBA code then essentially replicates the Excel method using a function to pass 2 arrays, periods and a return array that can be written to a range
EDIT:
This VBA code now calculates the linear trend of the points either side of the new period reduction. The data is returned in a 2dimension array named returnArray
Returns:
COLLAPSED
1 38.75%
2 34.35%
3 16.95%
4 9.95%