没有垂直线的直方图
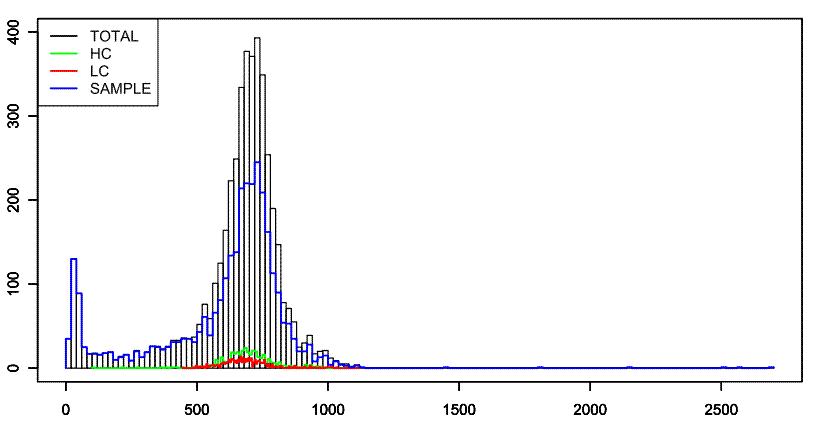
当我创建直方图时,它看起来很像这样:
set.seed(1)
x <- 1:100
y <- x + rnorm(50)
y=round(y)
hist(y)
有没有办法让直方图看起来有点像这样?我只能得到带有垃圾箱的直方图,我的绘图不需要它。 
我不需要黑色垃圾箱,实际上我只想要蓝色、绿色和红色线。 stackoverflow 能为我指明正确的方向吗?
When I create a histogram, it looks a lot like this:
set.seed(1)
x <- 1:100
y <- x + rnorm(50)
y=round(y)
hist(y)
Is there a way to make a histogram look a bit like this? I can only get a histogram with bins, which I don't need for my plot.
I don't want the black bins, I actually only want the blue, green and red lines. Can stackoverflow point me in the right direction?
如果你对这篇内容有疑问,欢迎到本站社区发帖提问 参与讨论,获取更多帮助,或者扫码二维码加入 Web 技术交流群。

绑定邮箱获取回复消息
由于您还没有绑定你的真实邮箱,如果其他用户或者作者回复了您的评论,将不能在第一时间通知您!

发布评论
评论(2)
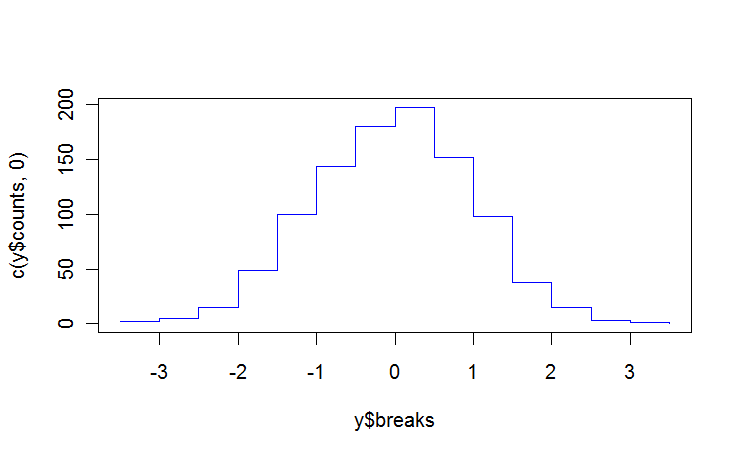
将直方图放入对象中,然后使用 type="s" 获取逐步图:
给出:

Put your histogram in an object, and use type="s" to get the stepwise plot :
gives :

如果您想保留直方图的(最终)颜色,您可以停用边框并自行将其添加到顶部。
If you want to keep the (eventual) coloring of you histogram, you can deactivate the border and add it yourself on top.