将经度/纬度转换为 X/Y 坐标
我使用 Google Maps API 创建了一张地图,突出显示了明尼苏达州的所有县。基本上,我使用一组经度/纬度坐标创建了县多边形。这是生成的地图的屏幕截图:-

用户要求之一是能够拥有类似的地图作为图像,以便他们可以将其嵌入到他们的 PowerPoint/主题幻灯片中。我找不到任何有用的 Google Maps API 可以让我按原样保存自定义地图(如果您知道一种方法,请告诉我),所以我想我应该用 Java 中的 Graphics2D 来绘制它。
在阅读了将经度/纬度转换为 X/Y 坐标的公式后,我最终得到了以下代码: -
private static final int    EARTH_RADIUS    = 6371;
private static final double FOCAL_LENGTH    = 500;

...

BufferedImage bi = new BufferedImage(WIDTH, HEIGHT, BufferedImage.TYPE_INT_RGB);
Graphics2D g = bi.createGraphics();

for (Coordinate coordinate : coordinates) {
    double latitude = Double.valueOf(coordinate.getLatitude());
    double longitude = Double.valueOf(coordinate.getLongitude());

    latitude = latitude * Math.PI / 180;
    longitude = longitude * Math.PI / 180;

    double x = EARTH_RADIUS * Math.sin(latitude) * Math.cos(longitude);
    double y = EARTH_RADIUS * Math.sin(latitude) * Math.sin(longitude);
    double z = EARTH_RADIUS * Math.cos(latitude);

    double projectedX = x * FOCAL_LENGTH / (FOCAL_LENGTH + z);
    double projectedY = y * FOCAL_LENGTH / (FOCAL_LENGTH + z);

    // scale the map bigger
    int magnifiedX = (int) Math.round(projectedX * 5);
    int magnifiedY = (int) Math.round(projectedY * 5);

    ...
    g.drawPolygon(...);
    ...
}
生成的地图与 Google Maps API 使用同一组经度/纬度生成的地图类似。然而,它看起来有点倾斜,看起来有点不对劲,我不知道如何解决这个问题。

如何使县的形状看起来与上面 Google Maps API 生成的形状一样?
非常感谢。
最终解决方案
感谢@QuantumMechanic 和@Anon,我终于找到了解决方案。
墨卡托投影在这里确实发挥了作用。我正在使用 Java 地图投影库 来执行墨卡托投影的计算。
private static final int    IMAGE_WIDTH     = 1000;
private static final int    IMAGE_HEIGHT    = 1000;
private static final int    IMAGE_PADDING   = 50;

...

private List<Point2D.Double> convertToXY(List<Coordinate> coordinates) {
    List<Point2D.Double> xys = new ArrayList<Point2D.Double>();

    MercatorProjection projection = new MercatorProjection();

    for (Coordinate coordinate : coordinates) {
        double latitude = Double.valueOf(coordinate.getLatitude());
        double longitude = Double.valueOf(coordinate.getLongitude());

        // convert to radian
        latitude = latitude * Math.PI / 180;
        longitude = longitude * Math.PI / 180;

        Point2D.Double d = projection.project(longitude, latitude, new Point2D.Double());

        // shift by 10 to remove negative Xs and Ys
        // scaling by 6000 to make the map bigger
        int magnifiedX = (int) Math.round((10 + d.x) * 6000);
        int magnifiedY = (int) Math.round((10 + d.y) * 6000);

        minX = (minX == -1) ? magnifiedX : Math.min(minX, magnifiedX);
        minY = (minY == -1) ? magnifiedY : Math.min(minY, magnifiedY);

        xys.add(new Point2D.Double(magnifiedX, magnifiedY));
    }

    return xys;
}

...
通过使用生成的 XY 坐标,地图看起来是倒置的,这是因为我相信 Graphics2D 的 0,0 从左上角开始。因此,我需要通过从图像高度中减去该值来反转 Y,如下所示:-
...

Polygon polygon = new Polygon();

for (Point2D.Double point : xys) {
    int adjustedX = (int) (IMAGE_PADDING + (point.getX() - minX));

    // need to invert the Y since 0,0 starts at top left
    int adjustedY = (int) (IMAGE_HEIGHT - IMAGE_PADDING - (point.getY() - minY));

    polygon.addPoint(adjustedX, adjustedY);
}

...
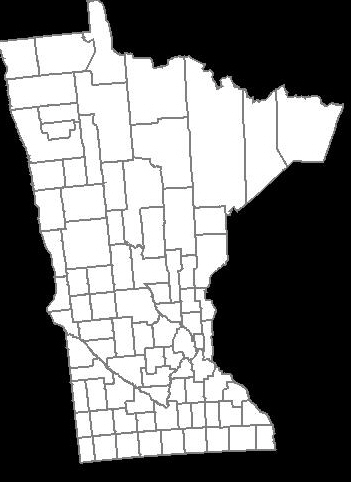
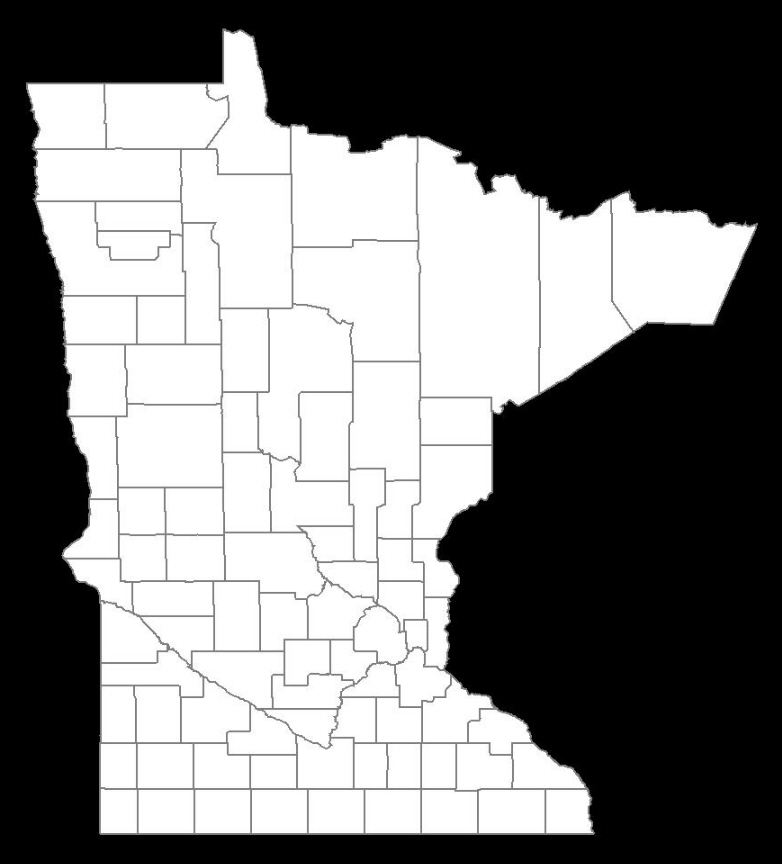
这是生成的地图:-
非常完美!
更新 01-25-2013
以下是根据宽度和高度(以像素为单位)创建图像映射的代码。在本例中,我不依赖 Java Map Project Library,而是提取相关公式并将其嵌入到我的代码中。与上面依赖任意缩放值的代码示例(上面的示例使用 6000)相比,这使您可以更好地控制地图生成。
public class MapService {
    // CHANGE THIS: the output path of the image to be created
    private static final String IMAGE_FILE_PATH = "/some/user/path/map.png";

    // CHANGE THIS: image width in pixel
    private static final int IMAGE_WIDTH_IN_PX = 300;

    // CHANGE THIS: image height in pixel
    private static final int IMAGE_HEIGHT_IN_PX = 500;

    // CHANGE THIS: minimum padding in pixel
    private static final int MINIMUM_IMAGE_PADDING_IN_PX = 50;

    // formula for quarter PI
    private final static double QUARTERPI = Math.PI / 4.0;

    // some service that provides the county boundaries data in longitude and latitude
    private CountyService countyService;

    public void run() throws Exception {
        // configuring the buffered image and graphics to draw the map
        BufferedImage bufferedImage = new BufferedImage(IMAGE_WIDTH_IN_PX,
                                                        IMAGE_HEIGHT_IN_PX,
                                                        BufferedImage.TYPE_INT_RGB);

        Graphics2D g = bufferedImage.createGraphics();
        Map<RenderingHints.Key, Object> map = new HashMap<RenderingHints.Key, Object>();
        map.put(RenderingHints.KEY_INTERPOLATION, RenderingHints.VALUE_INTERPOLATION_BICUBIC);
        map.put(RenderingHints.KEY_RENDERING, RenderingHints.VALUE_RENDER_QUALITY);
        map.put(RenderingHints.KEY_ANTIALIASING, RenderingHints.VALUE_ANTIALIAS_ON);
        RenderingHints renderHints = new RenderingHints(map);
        g.setRenderingHints(renderHints);

        // min and max coordinates, used in the computation below
        Point2D.Double minXY = new Point2D.Double(-1, -1);
        Point2D.Double maxXY = new Point2D.Double(-1, -1);

        // a list of counties where each county contains a list of coordinates that form the county boundary
        Collection<Collection<Point2D.Double>> countyBoundaries = new ArrayList<Collection<Point2D.Double>>();

        // for every county, convert the longitude/latitude to X/Y using Mercator projection formula
        for (County county : countyService.getAllCounties()) {
            Collection<Point2D.Double> lonLat = new ArrayList<Point2D.Double>();

            for (CountyBoundary countyBoundary : county.getCountyBoundaries()) {
                // convert to radian
                double longitude = countyBoundary.getLongitude() * Math.PI / 180;
                double latitude = countyBoundary.getLatitude() * Math.PI / 180;

                Point2D.Double xy = new Point2D.Double();
                xy.x = longitude;
                xy.y = Math.log(Math.tan(QUARTERPI + 0.5 * latitude));

                // The reason we need to determine the min X and Y values is because in order to draw the map,
                // we need to offset the position so that there will be no negative X and Y values
                minXY.x = (minXY.x == -1) ? xy.x : Math.min(minXY.x, xy.x);
                minXY.y = (minXY.y == -1) ? xy.y : Math.min(minXY.y, xy.y);

                lonLat.add(xy);
            }

            countyBoundaries.add(lonLat);
        }

        // readjust coordinate to ensure there are no negative values
        for (Collection<Point2D.Double> points : countyBoundaries) {
            for (Point2D.Double point : points) {
                point.x = point.x - minXY.x;
                point.y = point.y - minXY.y;

                // now, we need to keep track the max X and Y values
                maxXY.x = (maxXY.x == -1) ? point.x : Math.max(maxXY.x, point.x);
                maxXY.y = (maxXY.y == -1) ? point.y : Math.max(maxXY.y, point.y);
            }
        }

        int paddingBothSides = MINIMUM_IMAGE_PADDING_IN_PX * 2;

        // the actual drawing space for the map on the image
        int mapWidth = IMAGE_WIDTH_IN_PX - paddingBothSides;
        int mapHeight = IMAGE_HEIGHT_IN_PX - paddingBothSides;

        // determine the width and height ratio because we need to magnify the map to fit into the given image dimension
        double mapWidthRatio = mapWidth / maxXY.x;
        double mapHeightRatio = mapHeight / maxXY.y;

        // using different ratios for width and height will cause the map to be stretched. So, we have to determine
        // the global ratio that will perfectly fit into the given image dimension
        double globalRatio = Math.min(mapWidthRatio, mapHeightRatio);

        // now we need to readjust the padding to ensure the map is always drawn on the center of the given image dimension
        double heightPadding = (IMAGE_HEIGHT_IN_PX - (globalRatio * maxXY.y)) / 2;
        double widthPadding = (IMAGE_WIDTH_IN_PX - (globalRatio * maxXY.x)) / 2;

        // for each country, draw the boundary using polygon
        for (Collection<Point2D.Double> points : countyBoundaries) {
            Polygon polygon = new Polygon();

            for (Point2D.Double point : points) {
                int adjustedX = (int) (widthPadding + (point.getX() * globalRatio));

                // need to invert the Y since 0,0 starts at top left
                int adjustedY = (int) (IMAGE_HEIGHT_IN_PX - heightPadding - (point.getY() * globalRatio));

                polygon.addPoint(adjustedX, adjustedY);
            }

            g.drawPolygon(polygon);
        }

        // create the image file
        ImageIO.write(bufferedImage, "PNG", new File(IMAGE_FILE_PATH));
    }
}
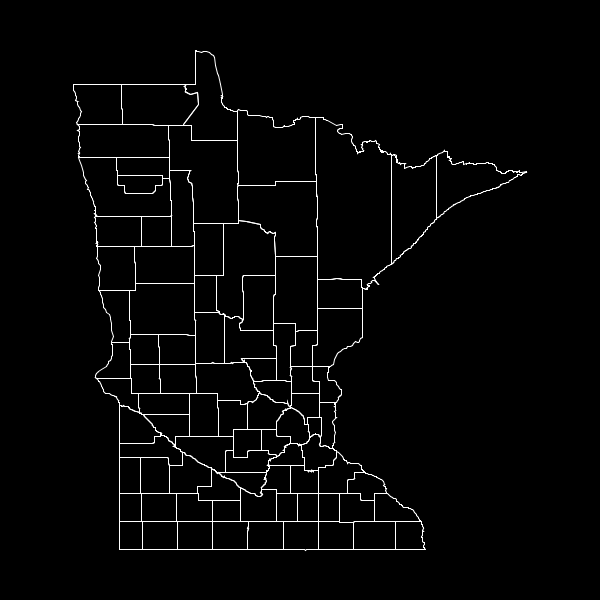
结果:图像宽度 = 600 像素,图像高度 = 600 像素,图像内边距 = 50 像素

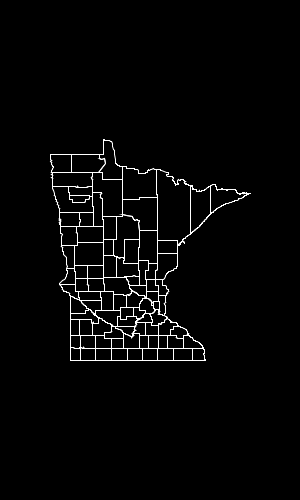
结果:图像宽度 = 300 像素,图像高度 = 500 像素,图像内边距 = 50 像素

I created a map using Google Maps API that highlights all Minnesota counties. Basically, I created the county polygons using a set of longitudes/latitudes coordinates. Here's a screenshot of the generated map:-

One of the user requirements is to be able to have a similar map as an image so that they can embed it in their PowerPoint/keynote slides. I couldn't find any useful Google Maps API that allows me to save my custom map the way it is (if you know a way, let me know), so I figure I should just draw it with Graphics2D in Java.
After reading about the formulas to convert the longitude/latitude to X/Y coordinate, I end up with the following code:-
private static final int    EARTH_RADIUS    = 6371;
private static final double FOCAL_LENGTH    = 500;

...

BufferedImage bi = new BufferedImage(WIDTH, HEIGHT, BufferedImage.TYPE_INT_RGB);
Graphics2D g = bi.createGraphics();

for (Coordinate coordinate : coordinates) {
    double latitude = Double.valueOf(coordinate.getLatitude());
    double longitude = Double.valueOf(coordinate.getLongitude());

    latitude = latitude * Math.PI / 180;
    longitude = longitude * Math.PI / 180;

    double x = EARTH_RADIUS * Math.sin(latitude) * Math.cos(longitude);
    double y = EARTH_RADIUS * Math.sin(latitude) * Math.sin(longitude);
    double z = EARTH_RADIUS * Math.cos(latitude);

    double projectedX = x * FOCAL_LENGTH / (FOCAL_LENGTH + z);
    double projectedY = y * FOCAL_LENGTH / (FOCAL_LENGTH + z);

    // scale the map bigger
    int magnifiedX = (int) Math.round(projectedX * 5);
    int magnifiedY = (int) Math.round(projectedY * 5);

    ...
    g.drawPolygon(...);
    ...
}
The generated map is similar the one generated by Google Maps API using the same set of longitudes/latitudes. However, it seems a little bit tilted and it looks a little off, and I'm not sure how to fix this.

How do I make the shape of the counties to look just like the one generated by Google Maps API above?
Thanks much.
FINAL SOLUTION
I finally found the solution thanks to @QuantumMechanic and @Anon.
The Mercator projection really does the trick here. I'm using Java Map Projection Library to perform the calculation for Mercator projection.
private static final int    IMAGE_WIDTH     = 1000;
private static final int    IMAGE_HEIGHT    = 1000;
private static final int    IMAGE_PADDING   = 50;

...

private List<Point2D.Double> convertToXY(List<Coordinate> coordinates) {
    List<Point2D.Double> xys = new ArrayList<Point2D.Double>();

    MercatorProjection projection = new MercatorProjection();

    for (Coordinate coordinate : coordinates) {
        double latitude = Double.valueOf(coordinate.getLatitude());
        double longitude = Double.valueOf(coordinate.getLongitude());

        // convert to radian
        latitude = latitude * Math.PI / 180;
        longitude = longitude * Math.PI / 180;

        Point2D.Double d = projection.project(longitude, latitude, new Point2D.Double());

        // shift by 10 to remove negative Xs and Ys
        // scaling by 6000 to make the map bigger
        int magnifiedX = (int) Math.round((10 + d.x) * 6000);
        int magnifiedY = (int) Math.round((10 + d.y) * 6000);

        minX = (minX == -1) ? magnifiedX : Math.min(minX, magnifiedX);
        minY = (minY == -1) ? magnifiedY : Math.min(minY, magnifiedY);

        xys.add(new Point2D.Double(magnifiedX, magnifiedY));
    }

    return xys;
}

...
By using the generated XY coordinate, the map seems inverted, and that's because I believe the graphics2D's 0,0 starts at top left. So, I need to invert the Y by subtracting the value from the image height, something like this:-
...

Polygon polygon = new Polygon();

for (Point2D.Double point : xys) {
    int adjustedX = (int) (IMAGE_PADDING + (point.getX() - minX));

    // need to invert the Y since 0,0 starts at top left
    int adjustedY = (int) (IMAGE_HEIGHT - IMAGE_PADDING - (point.getY() - minY));

    polygon.addPoint(adjustedX, adjustedY);
}

...
Here's the generated map:-

IT IS PERFECT!
UPDATE 01-25-2013
Here's the code to create the image map based on the width and height (in pixel). In this case, I'm not relying on the Java Map Project Library, instead, I extracted out the pertinent formula and embed it in my code. This gives you a greater control of the map generation, compared to the above code example that relies on an arbitrary scaling value (the example above uses 6000).
public class MapService {
    // CHANGE THIS: the output path of the image to be created
    private static final String IMAGE_FILE_PATH = "/some/user/path/map.png";

    // CHANGE THIS: image width in pixel
    private static final int IMAGE_WIDTH_IN_PX = 300;

    // CHANGE THIS: image height in pixel
    private static final int IMAGE_HEIGHT_IN_PX = 500;

    // CHANGE THIS: minimum padding in pixel
    private static final int MINIMUM_IMAGE_PADDING_IN_PX = 50;

    // formula for quarter PI
    private final static double QUARTERPI = Math.PI / 4.0;

    // some service that provides the county boundaries data in longitude and latitude
    private CountyService countyService;

    public void run() throws Exception {
        // configuring the buffered image and graphics to draw the map
        BufferedImage bufferedImage = new BufferedImage(IMAGE_WIDTH_IN_PX,
                                                        IMAGE_HEIGHT_IN_PX,
                                                        BufferedImage.TYPE_INT_RGB);

        Graphics2D g = bufferedImage.createGraphics();
        Map<RenderingHints.Key, Object> map = new HashMap<RenderingHints.Key, Object>();
        map.put(RenderingHints.KEY_INTERPOLATION, RenderingHints.VALUE_INTERPOLATION_BICUBIC);
        map.put(RenderingHints.KEY_RENDERING, RenderingHints.VALUE_RENDER_QUALITY);
        map.put(RenderingHints.KEY_ANTIALIASING, RenderingHints.VALUE_ANTIALIAS_ON);
        RenderingHints renderHints = new RenderingHints(map);
        g.setRenderingHints(renderHints);

        // min and max coordinates, used in the computation below
        Point2D.Double minXY = new Point2D.Double(-1, -1);
        Point2D.Double maxXY = new Point2D.Double(-1, -1);

        // a list of counties where each county contains a list of coordinates that form the county boundary
        Collection<Collection<Point2D.Double>> countyBoundaries = new ArrayList<Collection<Point2D.Double>>();

        // for every county, convert the longitude/latitude to X/Y using Mercator projection formula
        for (County county : countyService.getAllCounties()) {
            Collection<Point2D.Double> lonLat = new ArrayList<Point2D.Double>();

            for (CountyBoundary countyBoundary : county.getCountyBoundaries()) {
                // convert to radian
                double longitude = countyBoundary.getLongitude() * Math.PI / 180;
                double latitude = countyBoundary.getLatitude() * Math.PI / 180;

                Point2D.Double xy = new Point2D.Double();
                xy.x = longitude;
                xy.y = Math.log(Math.tan(QUARTERPI + 0.5 * latitude));

                // The reason we need to determine the min X and Y values is because in order to draw the map,
                // we need to offset the position so that there will be no negative X and Y values
                minXY.x = (minXY.x == -1) ? xy.x : Math.min(minXY.x, xy.x);
                minXY.y = (minXY.y == -1) ? xy.y : Math.min(minXY.y, xy.y);

                lonLat.add(xy);
            }

            countyBoundaries.add(lonLat);
        }

        // readjust coordinate to ensure there are no negative values
        for (Collection<Point2D.Double> points : countyBoundaries) {
            for (Point2D.Double point : points) {
                point.x = point.x - minXY.x;
                point.y = point.y - minXY.y;

                // now, we need to keep track the max X and Y values
                maxXY.x = (maxXY.x == -1) ? point.x : Math.max(maxXY.x, point.x);
                maxXY.y = (maxXY.y == -1) ? point.y : Math.max(maxXY.y, point.y);
            }
        }

        int paddingBothSides = MINIMUM_IMAGE_PADDING_IN_PX * 2;

        // the actual drawing space for the map on the image
        int mapWidth = IMAGE_WIDTH_IN_PX - paddingBothSides;
        int mapHeight = IMAGE_HEIGHT_IN_PX - paddingBothSides;

        // determine the width and height ratio because we need to magnify the map to fit into the given image dimension
        double mapWidthRatio = mapWidth / maxXY.x;
        double mapHeightRatio = mapHeight / maxXY.y;

        // using different ratios for width and height will cause the map to be stretched. So, we have to determine
        // the global ratio that will perfectly fit into the given image dimension
        double globalRatio = Math.min(mapWidthRatio, mapHeightRatio);

        // now we need to readjust the padding to ensure the map is always drawn on the center of the given image dimension
        double heightPadding = (IMAGE_HEIGHT_IN_PX - (globalRatio * maxXY.y)) / 2;
        double widthPadding = (IMAGE_WIDTH_IN_PX - (globalRatio * maxXY.x)) / 2;

        // for each country, draw the boundary using polygon
        for (Collection<Point2D.Double> points : countyBoundaries) {
            Polygon polygon = new Polygon();

            for (Point2D.Double point : points) {
                int adjustedX = (int) (widthPadding + (point.getX() * globalRatio));

                // need to invert the Y since 0,0 starts at top left
                int adjustedY = (int) (IMAGE_HEIGHT_IN_PX - heightPadding - (point.getY() * globalRatio));

                polygon.addPoint(adjustedX, adjustedY);
            }

            g.drawPolygon(polygon);
        }

        // create the image file
        ImageIO.write(bufferedImage, "PNG", new File(IMAGE_FILE_PATH));
    }
}
RESULT: Image width = 600px, Image height = 600px, Image padding = 50px

RESULT: Image width = 300px, Image height = 500px, Image padding = 50px

如果你对这篇内容有疑问,欢迎到本站社区发帖提问 参与讨论,获取更多帮助,或者扫码二维码加入 Web 技术交流群。

绑定邮箱获取回复消息
由于您还没有绑定你的真实邮箱,如果其他用户或者作者回复了您的评论,将不能在第一时间通知您!


发布评论
评论(3)
绘制地图的一个大问题是地球的球形表面无法方便地转换为平面表示。有许多不同的预测试图解决这个问题。
墨卡托是最简单的一种:它假设等纬度的线是平行的水平线,而等纬度的线是平行的。等经度是平行的垂直线。这对于纬度有效(无论您在哪里,1 纬度大约等于 111 公里),但对于经度无效(经度的表面距离与纬度的余弦成正比)。
然而,只要温度低于 45 度(明尼苏达州的大部分地区都是如此),墨卡托投影就可以很好地工作,并创建大多数人会从小学地图中识别的形式。这非常简单:只需将这些点视为绝对坐标,然后缩放到您在其中绘制它们的任何空间。无需触发。
The big issue with plotting maps is that the spherical surface of the Earth cannot be conveniently converted into a flat representation. There are a bunch of different projections that attempt to resolve this.
Mercator is one of the simplest: it assumes that lines of equal latitude are parallel horizontals, while lines of equal longitude are parallel verticals. This is valid for latitude (1 degree of latitude approximately equals 111 km no matter where you are), but not valid for longitude (the surface distance of a degree of longitude is proportional to the cosine of the latitutude).
However, as long as you're below about 45 degrees (which most of Minnesota is), a Mercator projection works very well, and creates the forms that most people will recognize from their grade school maps. And it's very simple: just treat the points as absolute coordinates, and scale to whatever space you're drawing them in. No trig necessary.
要将 lat/lon/alt(lat 以北度为单位,lon 以东度为单位,alt 以米为单位)转换为以地心固定坐标 (x,y,z),请执行以下操作:
To convert lat/lon/alt (lat in degrees North, lon in degrees East, alt in meters) to earth centered fixed coordinates (x,y,z), do the following:
请记住,地图的外观取决于用于渲染地图的投影。谷歌地图似乎使用墨卡托投影(或与之非常相似的投影)。你的算法相当于什么投影?如果您希望 2D 表示看起来像 Google 的一样,则需要使用相同的投影。
Remember that how a map looks is a function of the projection used to render the map. Google Maps appears to use a Mercator projection (or something very similar to it). What projection does your algorithm equate to? If you want your 2D representation to look just like Google's you need to use an identical projection.