如何使用另一个JFrame调用JChart2D动态图
我正在使用 JChart2d (http://jchart2d.sourceforge.net/index.shtml)用于动态跟踪双精度数组的值。当我在 main 方法中编写配置并运行它时,它运行得很好。

这是代码。
public  class WaveTracer {

    ITrace2D trace ;
    Chart2D chart ;
    double dataArray [];
    JFrame frame;

public WaveTracer(int limit , double [] data){

trace = new Trace2DLtd(limit);

    dataArray = data;

}

public void configure(String framename, int fwidth , int fheight, int xpos , int ypos ){
    try{

    chart = new Chart2D();

    trace.setColor(Color.RED);

    frame = new JFrame(framename);

    frame.addWindowListener(new WindowAdapter() {
        /**
         * @see java.awt.event.WindowAdapter#windowClosing(java.awt.event.WindowEvent)
         */

        @Override

        public void windowClosing(final WindowEvent e) {

          System.exit(0);

        }

      });

      frame.getContentPane().add(chart);

      frame.setSize(fwidth, fheight);

      frame.setLocation(xpos, ypos);

    }catch (Throwable f) {
      System.exit(0);
    }
}

public void trace(int speed) throws InterruptedException{

    frame.setVisible(true);

    chart.addTrace(trace);

        for (int j = 0; j < dataArray.length; j++) {

          trace.addPoint(j,dataArray[j]);

          Thread.sleep(speed);

         }

    System.exit(0);

}

public static void main(String args []){

      Random random = new Random();

    double d[] = new double[2000];

    int count=1;

    for(int i=200;i>=0;i--){

      d[200-i] = random.nextDouble()*10.0;

    }

         WaveTracer wavetracer = new WaveTracer(5000, d);

         wavetracer.configure("plying wave form with time", 1000, 500, 200, 200);

        try {

            wavetracer.trace(150);

        } catch (InterruptedException ex) {

            Logger.getLogger(FrequencyDitectorForm.class.getName()).log(Level.SEVERE, null, ex);
        }

}

}
但是当我单击另一种形式的“绘制”按钮时,我需要绘制图形。我创建了一个包含“绘制”按钮的表单,并将以下代码添加到操作单击中。
 JFrame dialog = new JFrame();

 Random random = new Random();

    double d[] = new double[2000];

    int count=1;

    for(int i=200;i>=0;i--){

      d[200-i] = random.nextDouble()*10.0;

    }

WaveTracer wavetracer = new WaveTracer(5000, d);

         wavetracer.configure("plying wave form with time", 1000, 500, 200, 200);

        try {

            wavetracer.trace(150);
        } catch (InterruptedException ex) {
            Logger.getLogger(FrequencyDitectorForm.class.getName()).log(Level.SEVERE, null, ex);
        }

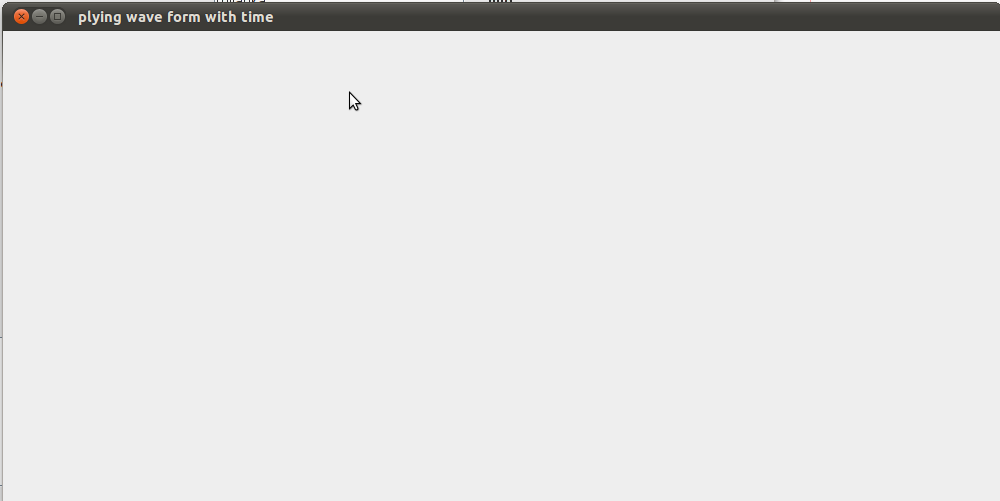
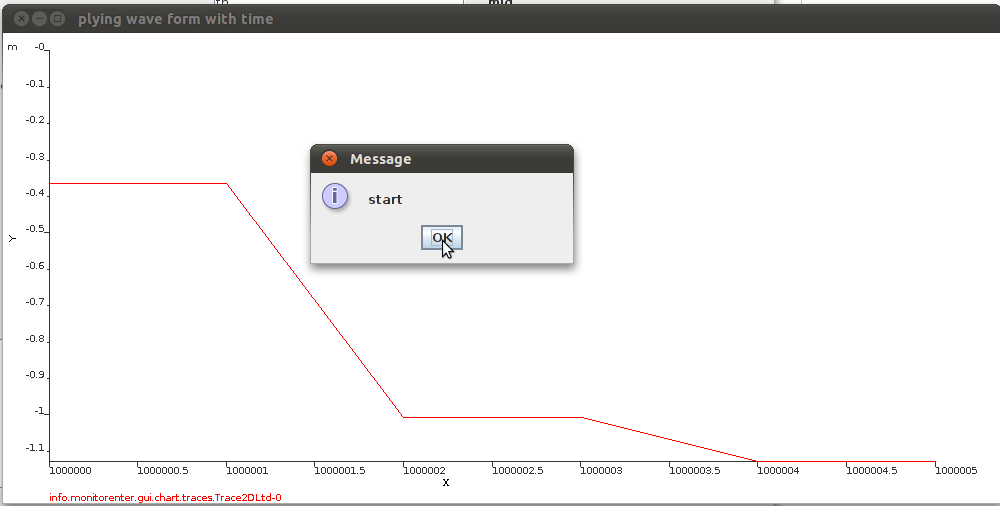
但是当我单击该按钮时,仅加载新框架,并且框架中不显示任何内容。然后我通过向循环添加消息框来测试循环。在这种情况下,它显示循环每次迭代的图表。

有人可以帮助我解决这个问题吗?如何从单独的表单中绘制此图,而不在循环的每个周期中触发消息框。
I'm Using JChart2d (http://jchart2d.sourceforge.net/index.shtml) for trace a values of a double array dynamically. when I code the configuration in the main method and run it it run perfectly.

Here is the code.
public  class WaveTracer {

    ITrace2D trace ;
    Chart2D chart ;
    double dataArray [];
    JFrame frame;

public WaveTracer(int limit , double [] data){

trace = new Trace2DLtd(limit);

    dataArray = data;

}

public void configure(String framename, int fwidth , int fheight, int xpos , int ypos ){
    try{

    chart = new Chart2D();

    trace.setColor(Color.RED);

    frame = new JFrame(framename);

    frame.addWindowListener(new WindowAdapter() {
        /**
         * @see java.awt.event.WindowAdapter#windowClosing(java.awt.event.WindowEvent)
         */

        @Override

        public void windowClosing(final WindowEvent e) {

          System.exit(0);

        }

      });

      frame.getContentPane().add(chart);

      frame.setSize(fwidth, fheight);

      frame.setLocation(xpos, ypos);

    }catch (Throwable f) {
      System.exit(0);
    }
}

public void trace(int speed) throws InterruptedException{

    frame.setVisible(true);

    chart.addTrace(trace);

        for (int j = 0; j < dataArray.length; j++) {

          trace.addPoint(j,dataArray[j]);

          Thread.sleep(speed);

         }

    System.exit(0);

}

public static void main(String args []){

      Random random = new Random();

    double d[] = new double[2000];

    int count=1;

    for(int i=200;i>=0;i--){

      d[200-i] = random.nextDouble()*10.0;

    }

         WaveTracer wavetracer = new WaveTracer(5000, d);

         wavetracer.configure("plying wave form with time", 1000, 500, 200, 200);

        try {

            wavetracer.trace(150);

        } catch (InterruptedException ex) {

            Logger.getLogger(FrequencyDitectorForm.class.getName()).log(Level.SEVERE, null, ex);
        }

}

}
But I need draw the graph when I click on a "Draw" button which in in another form. I created a form which contains a button "Draw" and added the following code to the action click.
 JFrame dialog = new JFrame();

 Random random = new Random();

    double d[] = new double[2000];

    int count=1;

    for(int i=200;i>=0;i--){

      d[200-i] = random.nextDouble()*10.0;

    }

WaveTracer wavetracer = new WaveTracer(5000, d);

         wavetracer.configure("plying wave form with time", 1000, 500, 200, 200);

        try {

            wavetracer.trace(150);
        } catch (InterruptedException ex) {
            Logger.getLogger(FrequencyDitectorForm.class.getName()).log(Level.SEVERE, null, ex);
        }

But when I click on that button only the new frame loads and shows nothing in the frame. Then I have tested the loop by adding a messagebox to the loop. In that case it show the graph for each iteration of the loop.

Can some one please help me on this issue. How can I get draw this graph from a separate form without triggering a messagebox in every cycle of a loop.
如果你对这篇内容有疑问,欢迎到本站社区发帖提问 参与讨论,获取更多帮助,或者扫码二维码加入 Web 技术交流群。

绑定邮箱获取回复消息
由于您还没有绑定你的真实邮箱,如果其他用户或者作者回复了您的评论,将不能在第一时间通知您!

发布评论
评论(2)
您在事件调度线程或 EDT(负责绘图和用户交互的主 Swing 线程)上调用 Thread.sleep(...),从而使整个 GUI 进入睡眠状态。不要这样做,而是使用 Swing Timer 或后台线程。
另外,只是一个设计问题:您确定要在单独的 JFrame 而不是 JPanel 中显示它,还是需要单独的窗口、JDialog?您确定要从图形类中调用 System.exit(0) 吗?
You're calling Thread.sleep(...) on the Event Dispatch Thread or EDT, the main Swing thread that is responsible for drawing and user interaction, and thus putting your whole GUI to sleep. Don't do this, but instead use a Swing Timer or a background thread.
Also, just a design question: are you sure that you want to display this in a separate JFrame and not a JPanel or if you need a separate window, a JDialog? And are you sure that you want to call System.exit(0) from within the graphing class?
您使用的是最新版本的 jchart2d 3.2.1 吗?我修复了与某些“树锁”相关的死锁。如果是这样,我必须仔细观察。然后我建议您随代码一起提交错误。
亲切的问候,
阿希姆
are you using the latest version 3.2.1 of jchart2d? I fixed a deadlock related to some "treelock". If so, I had to look closer. Then I'd recommend you submit a bug along with your code.
kind regards,
Achim