如何让点并排绘制连接的子图?
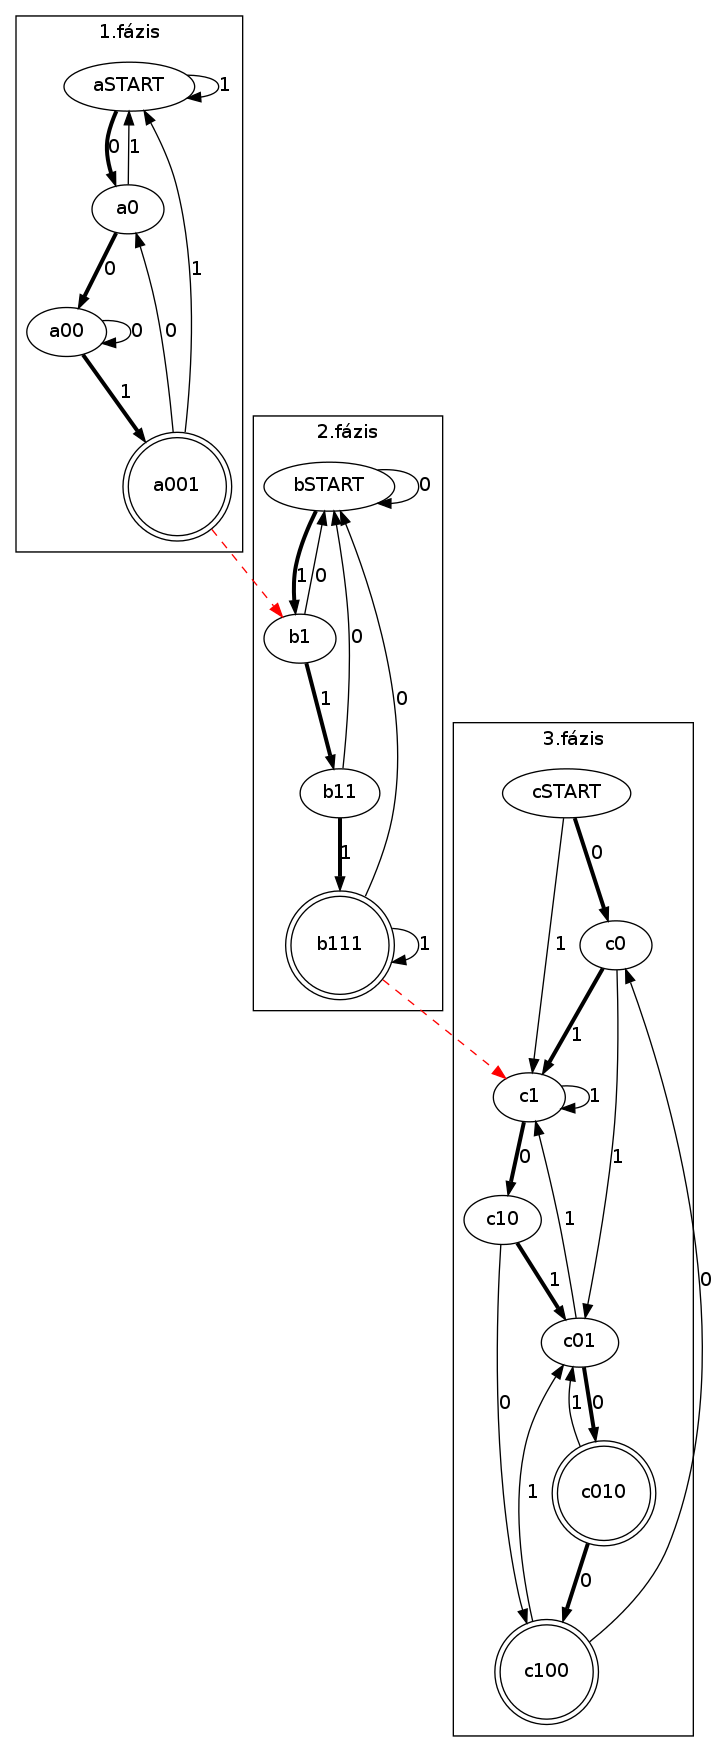
这是生成的图表当前的样子:  这是代码:
这是代码:
  digraph {
  rankdir=TB;
  subgraph cluster01 {
    label="1.fázis"

    aSTART;
    node [shape = doublecircle]; a001;
    node [shape = ellipse];

    aSTART -> a0 [ penwidth = 3 label = "0" ];
    a0 -> a00 [ penwidth = 3 label = "0" ];
    a00 -> a001 [ penwidth = 3 label = "1" ];


    a0 -> aSTART [ label = "1" ];
    a00 -> a00 [ label = "0" ];
    a001 -> a0 [ label = "0"];
    a001 -> aSTART [ label = "1"];
    aSTART -> aSTART [ label = "1"];
  }
  subgraph cluster02
  {
  label="2.fázis"
  bSTART; b1; b11;
  node [shape = doublecircle]; b111;
  node [shape = ellipse];

  bSTART -> b1 [ penwidth = 3 label = "1" ];
  b1 -> b11 [ penwidth = 3 label = "1" ];
  b11 -> b111 [ penwidth = 3 label = "1" ];

  b1 -> bSTART [ label = "0" ];
  b11 -> bSTART [ label = "0" ];
  b111 -> bSTART [ label = "0"];
  bSTART -> bSTART [ label = "0"];

  b111 -> b111 [label = "1"];
  }

  subgraph cluster03
  {
  label="3.fázis";

    cSTART; c0; c1; c01; c10;
    node [shape = doublecircle]; c010; c100;
    node [shape = ellipse];

    cSTART -> c0 [ penwidth = 3 label = "0" ];
    c0 -> c01 [ label = "1" ];
    c01 -> c010 [ penwidth = 3 label = "0" ];

    cSTART -> c1 [ label = "1" ];
    c1 -> c10 [ penwidth = 3 label = "0" ];
    c10 -> c100 [ label = "0" ];

    c0 -> c1 [ penwidth = 3 label = "1" ];
    c01 -> c1 [ label = "1" ];
    c1 -> c1 [label = "1"];

    c10 -> c01 [ penwidth = 3 label = "1"];

    c010 -> c100 [penwidth = 3 label = "0"];
    c010 -> c01 [label = "1"];

    c100 -> c01 [label = "1"];
    c100 -> c0 [label = "0"];

  }

  a001 -> b1 [color = "red" style = "dashed"];
  b111 -> c1 [color = "red" style = "dashed"];
}
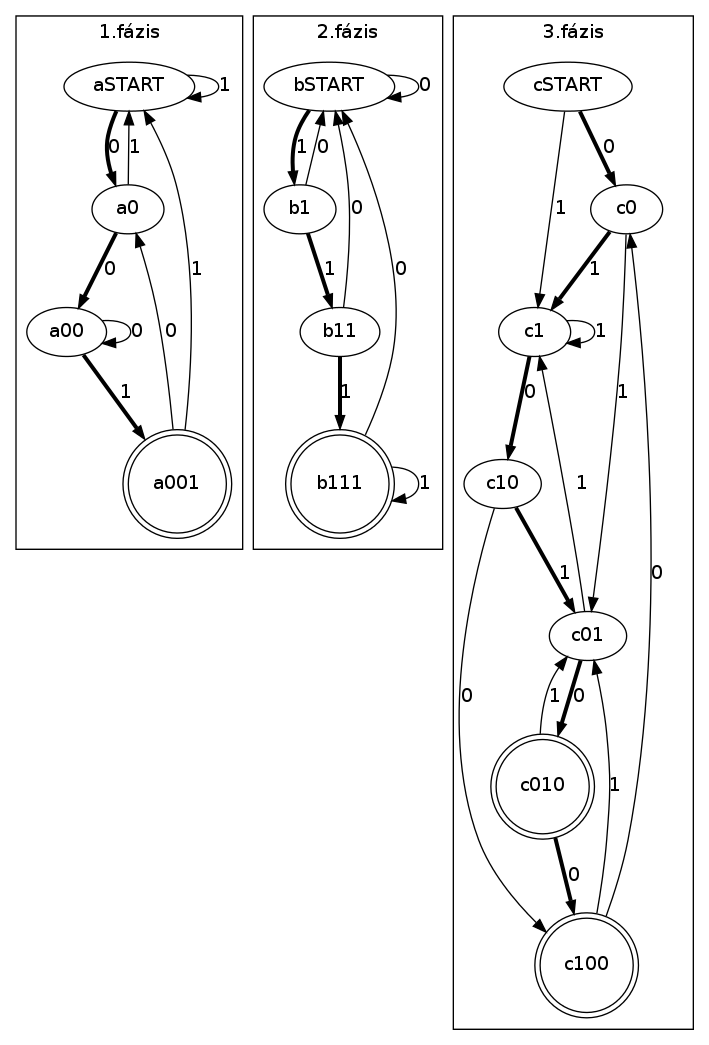
如果我删除 2 条红线,那么它就会按照我想要的方式排列: 
我怎样才能让它像这样排列并同时有两条红线?
This is what the generated graph looks currently:
And here is the code for this:
  digraph {
  rankdir=TB;
  subgraph cluster01 {
    label="1.fázis"

    aSTART;
    node [shape = doublecircle]; a001;
    node [shape = ellipse];

    aSTART -> a0 [ penwidth = 3 label = "0" ];
    a0 -> a00 [ penwidth = 3 label = "0" ];
    a00 -> a001 [ penwidth = 3 label = "1" ];


    a0 -> aSTART [ label = "1" ];
    a00 -> a00 [ label = "0" ];
    a001 -> a0 [ label = "0"];
    a001 -> aSTART [ label = "1"];
    aSTART -> aSTART [ label = "1"];
  }
  subgraph cluster02
  {
  label="2.fázis"
  bSTART; b1; b11;
  node [shape = doublecircle]; b111;
  node [shape = ellipse];

  bSTART -> b1 [ penwidth = 3 label = "1" ];
  b1 -> b11 [ penwidth = 3 label = "1" ];
  b11 -> b111 [ penwidth = 3 label = "1" ];

  b1 -> bSTART [ label = "0" ];
  b11 -> bSTART [ label = "0" ];
  b111 -> bSTART [ label = "0"];
  bSTART -> bSTART [ label = "0"];

  b111 -> b111 [label = "1"];
  }

  subgraph cluster03
  {
  label="3.fázis";

    cSTART; c0; c1; c01; c10;
    node [shape = doublecircle]; c010; c100;
    node [shape = ellipse];

    cSTART -> c0 [ penwidth = 3 label = "0" ];
    c0 -> c01 [ label = "1" ];
    c01 -> c010 [ penwidth = 3 label = "0" ];

    cSTART -> c1 [ label = "1" ];
    c1 -> c10 [ penwidth = 3 label = "0" ];
    c10 -> c100 [ label = "0" ];

    c0 -> c1 [ penwidth = 3 label = "1" ];
    c01 -> c1 [ label = "1" ];
    c1 -> c1 [label = "1"];

    c10 -> c01 [ penwidth = 3 label = "1"];

    c010 -> c100 [penwidth = 3 label = "0"];
    c010 -> c01 [label = "1"];

    c100 -> c01 [label = "1"];
    c100 -> c0 [label = "0"];

  }

  a001 -> b1 [color = "red" style = "dashed"];
  b111 -> c1 [color = "red" style = "dashed"];
}
If I remove the 2 red lines, then it lines up the way I want it to:
How could I make it line up like this and have the two red lines at the same time?
如果你对这篇内容有疑问,欢迎到本站社区发帖提问 参与讨论,获取更多帮助,或者扫码二维码加入 Web 技术交流群。

绑定邮箱获取回复消息
由于您还没有绑定你的真实邮箱,如果其他用户或者作者回复了您的评论,将不能在第一时间通知您!


发布评论
评论(2)
添加
您可以在子图 cluster03 之后 。 Dot 会向您发出警告,但可以按照您想要的方式绘制:
此处提供修补图
You can add
After your subgraph cluster03. Dot will yield you a warning but draw the way yo want:
Patched graph available here
您应该使用
constraint=false两个红色边缘上的属性。You should use the
constraint=falseattribute on the two red edges.