Visual Studio 2010 调试器的一个奇怪的例子(它不能命中断点)
Visual Studio 2010调试器的一个奇怪的例子(它不能打断点)
这是重现问题的代码:
class Program {
  static void Main(string[] args) {
    bool b = false;

    if (b) {
        List<string> list = new List<string>();
        foreach (var item in list) {

        }
    } else {
        Console.WriteLine("1");
    }
    Console.WriteLine("2");//add a break point here in VS2010
  }
  //1. configuration: release
  //2. platform target: x64 or Any Cpu
  //3. debug info: pdb only or full
  //4. OS: Win7 x64
  //5. optimize code: enabled
}
在代码的最后一条语句中添加一个断点,然后在vs2010中调试它,你会看到无法击中断点。
要重现这个奇怪的案例,您需要满足以下条件:
- 操作系统:windows 7 x64;
- VS构建配置:发布;
- VS构建平台目标:x64或Any Cpu;
- VS 构建调试信息:仅 pdb 或完整;
- VS构建优化代码:启用;
我不确定这些条件是否足以重现它,但这就是我发现此问题时我的机器的配置方式。
为什么调试器无法命中断点?
提前致谢!
如果您可以重现此问题,请考虑投票 这篇文章。
A curious case of Visual Studio 2010 debugger(it can not hit a break point)
This is the code that reproduces the problem:
class Program {
  static void Main(string[] args) {
    bool b = false;

    if (b) {
        List<string> list = new List<string>();
        foreach (var item in list) {

        }
    } else {
        Console.WriteLine("1");
    }
    Console.WriteLine("2");//add a break point here in VS2010
  }
  //1. configuration: release
  //2. platform target: x64 or Any Cpu
  //3. debug info: pdb only or full
  //4. OS: Win7 x64
  //5. optimize code: enabled
}
Add a break point to the last statement of the code, then debug it in vs2010, you'll see that the break point can not be hit.
To reproduce this curious case, you'll need to meet the following conditions:
- Operation system: windows 7 x64;
- VS build configuration: release;
- VS build platform target: x64 or Any Cpu;
- VS build debug info: pdb only or full;
- VS build optimize code: enabled;
I am not sure those conditions are sufficient to reproduce it, but it's how my machine was configured when I found this issue.
Why is the debugger not able to hit the break point?
Thanks in advance!
And if you can reproduce this issue, please consider voting on this post.
如果你对这篇内容有疑问,欢迎到本站社区发帖提问 参与讨论,获取更多帮助,或者扫码二维码加入 Web 技术交流群。

绑定邮箱获取回复消息
由于您还没有绑定你的真实邮箱,如果其他用户或者作者回复了您的评论,将不能在第一时间通知您!

发布评论
评论(6)
当提供的示例在发布模式下构建然后 JIT 为 64 位机器代码时,它不包含足够的信息供调试器将断点与任何特定机器指令关联起来。这就是为什么调试器在执行 JIT 机器代码期间永远不会在此断点处停止的原因。它只是不知道在哪里停止。它可能是某种不当行为,甚至是 64 位 CLR 调试器中的错误,因为只有当它被 JIT 编译成 64 位机器代码而不是 32 位机器代码时才可以重现。
当调试器在代码中看到断点时,它会尝试在 JIT 代码中查找与断点标记的位置相对应的机器指令。首先,它需要找到与 C# 代码中的断点位置相对应的 IL 指令。然后它需要找到与IL命令对应的机器指令。然后它在找到的机器指令上设置一个真正的断点并开始执行该方法。在您的情况下,调试器似乎只是忽略断点,因为它无法将其映射到特定的机器指令。
调试器无法找到紧跟在 if...else 语句之后的机器指令的地址。 if...else 语句及其内部的代码以某种方式导致了这种行为。 if...else 之后的语句是什么并不重要。您可以将 Console.WriteLine(“2”) 语句替换为其他语句,您仍然能够重现该问题。
如果您使用 Reflector 反汇编生成的程序集,您将看到 C# 编译器在读取列表的逻辑周围发出一个 try...catch 块。这是 C# 编译器的记录功能。您可以在 foreach 语句
try...catch...finally 块对 JIT 代码具有相当大的侵入性影响。它在底层使用 Windows SEH 机制并严重重写您的代码。我现在找不到一篇好文章的链接,但我相信如果您感兴趣的话,您可以在那里找到一篇文章。
这就是这里发生的事情。 if...else 语句内的 try...finally 块会导致调试器出现问题。您可以使用非常简单的代码重现您的问题。
此代码不调用任何外部函数(它消除了答案之一提出的方法内联的影响),并且它直接编译为 IL,无需 C# 编译器添加任何额外的代码。
它只能在发布模式下重现,因为在调试模式下,编译器会为 C# 代码的每一行发出 IL NOP 指令。 IL NOP 指令不执行任何操作,并且由也不执行任何操作的 JITer 直接编译为 CPU NOP 指令。该指令的有用之处在于,即使其余代码被 JITer 严重重写,调试器也可以将其用作断点的锚点。
通过在 if...else 后面的语句之前放置一条 NOP 指令,我能够使调试器正常工作。
您可以在此处阅读有关 NOP 操作和调试器映射过程的更多信息 调试IL
您可以尝试使用 WinDbg 和 SOS 扩展来检查该方法的 JIT 版本。您可以尝试检查 JIT-er 生成的机器代码,并尝试理解为什么它无法将该机器代码映射回 C# 的特定行。
这里有几个关于使用 WinDbg 中断托管代码并获取 JIT 方法的内存地址的链接。我相信您应该能够找到一种方法从那里获取方法的 JIT 代码: 在 WinDbg 中为托管代码设置断点,SOS 备忘单 (.NET 2.0/3.0/3.5)。
您还可以尝试向 Microsoft 报告问题。这可能是 CLR 调试器错误。
谢谢你提出这个有趣的问题。
When the provided example is built in release mode and then JIT-ed into 64-bit machine code, it does not contain enough information for the debugger to correlate the breakpoint with any particular machine instruction. That’s why debugger never stops at this breakpoint during execution of a JIT-ed machine code. It just does not know where to stop. Probably it is some kind of misbehavior or even a bug in 64-bit CLR debugger because it is reproducible only when it is JIT-ed into 64-bit machine code but not into 32-bit machine code.
When the debugger sees a breakpoint in your code it tries to find out a machine instruction in the JIT-ed code that corresponds to the location marked by the breakpoint. First, it needs to find an IL instruction that corresponds to a breakpoint location in your C# code. Then it needs to find a machine instruction that corresponds to the IL command. Then it sets a real breakpoint on the found machine instruction and starts execution of the method. In your case, it looks like that the debugger just ignores a breakpoint because it cannot map it to a particular machine instruction.
The debugger cannot find an address of a machine instruction that immediately follows if…else statement. The if…else statement and the code inside it somehow causes this behavior. It does not matter what statement follows the if…else. You can replace the Console.WriteLine(“2”) statement with some other one and you will be still able to reproduce the issue.
You will see that the C# compiler emits a try…catch block around the logic that reads the list if you will disassemble the resulting assembly with Reflector. It is a documented feature of the C# compiler. You can read more about it at The foreach statement
A try…catch…finally block has a pretty invasive effect on a JIT-ed code. It uses the Windows SEH mechanism under the hood and rewrites your code badly. I cannot find a link to a good article right now but I’m sure that you can find one out there if you are interested.
It is what happens here. The try…finally block inside of if…else statement causes the debugger to hiccup. You can reproduce your issue with a much simple code.
This code does not call any external functions (it eliminates effect of method inlining proposed by one of the answers) and it compiles directly into IL without any additional coded added by the C# compiler.
It is reproducible only in release mode because in the debug mode the compiler emits the IL NOP instruction for every line of your C# code. The IL NOP instruction does nothing and it is directly compiled to the CPU NOP instruction by the JITer that does nothing too. The usefulness of this instruction is that it can be used by the debugger as an anchor for breakpoints even if the rest of the code is badly rewritten by the JITer.
I was able to make the debugger to work correctly by putting one NOP instruction right before the statement that follows the if…else.
You can read more about NOP operations and debugger mapping process here Debugging IL
You can try to use WinDbg and SOS extension for it to examine JIT-ed version of the method. You can try to examine machine code that JIT-er generates and try to understand why it cannot map back that machine code to particular line of C#.
Here are couple link about using WinDbg for breaking in managed code and getting a memory address of a JIT-ed method. I believe that you should be able to find a way to get JIT-ed code for a method from there: Setting a breakpoint in WinDbg for Managed Code, SOS Cheat Sheet (.NET 2.0/3.0/3.5).
You can also try to report an issue to Microsoft. Probably this is a CLR debugger bug.
Thank you for the interesting question.
使用VS2010 SP1,如果在发布模式下设置断点,它会停在最后一行。您确实应该安装它,它特别提到它修复了调试器问题,有时它会跳过断点(尽管不是这种特定情况)。
Using VS2010 SP1, it stops on the last line if you set a breakpoint in release mode. You should really install it, it specifically mentions it fixes debugger issues where it would sometimes skip over breakpoints (although not this specific case).
将构建配置更改为“调试”,而不是“发布”。
Change your build configuration to "Debug", instead of "Release".
JIT 编译器使用的优化技术可能会导致这种情况。
其中一种优化称为方法内联,它可能是造成这种行为的原因。
我现在无法准确判断,因为我正在使用另一个人的计算机......但您可以自己测试一下:
1)创建以下方法:
2)仅用“MyMethod”替换对“Console.WriteLine”的调用
3)设置断点,然后尝试一下。
4) 现在,从方法“MyMethod”中删除“MethodImpl”属性。
5) 再次运行,断点在同一位置。
6)如果它在第一次运行时停止,但在第二次运行时没有停止......那么这就是原因。
The JIT compiler uses optimization techniques that may cause this.
One such optimization is called method inlining, that may be responsible for this behavior.
I cannot tell exactly right now, because I am using another person's computer... but you can test that yourself:
1) Create the following method:
2) replace the calls to "Console.WriteLine" with just "MyMethod"
3) Set the breakpoint, and try it.
4) Now, remove the "MethodImpl" attribute from the method "MyMethod".
5) Run again, with the breakpoint in the same place.
6) If it stops in the first run, but not in the second run... then this is the reason.
我认为当您使用发布模式进行调试时,您的断点可能与代码中的实际行不对应,因为机器代码可能已经过优化。在您的代码的情况下,您实际上没有执行打印“1”然后“2”的任何部分,因此可以安全地假设编译器会删除 (b==false) 的代码,因为它永远不会达到了。
I think that when you debug using release mode your breakpoints may not correspond to actual lines in the code because the machine code may have been optimized. In the case of your code you are actually not doing anything part from printing "1" and then "2" so it would be safe to assume that the compiler would remove the code of the (b==false) since it will never be reached.
构建版本省略了创建调试符号,这本身是显而易见的。
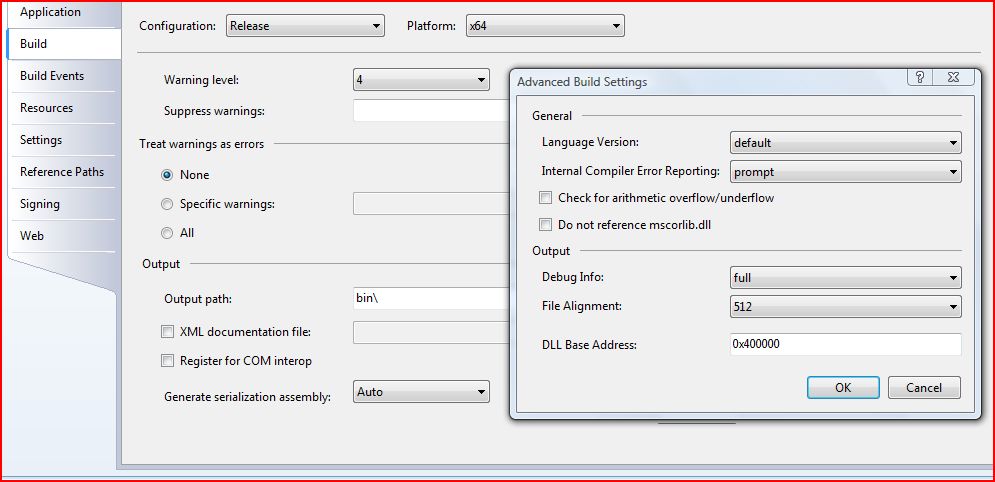
您可以通过转到项目的属性来覆盖它。选择发布配置并点击构建选项卡上的“高级”。将调试信息设置为完整。

Building the release omits creating the debug-symbols, which in itself is obvious.
You can override this by going to the properties of your project. select the Release-configuration and hit 'Advanced' on the Build-tab. Set the Debug-Info to full.
