xdebug vim 插件不显示变量值 (php)
我使用的是 Ubuntu 10.04 LTS
vim 版本 7.2.330
xdebug vim 插件版本 1.1.1 (从 http://www.vim.org/scripts/script.php?script_id=1929)
PHP 5.3.2
Apache/2.2.14
Xdebug v2.0.5
我的 中有这些选项/etc/php5/apache2/php.ini 文件
[debug]
; Remote settings
xdebug.remote_autostart=off
xdebug.remote_enable=on
xdebug.remote_handler=dbgp
xdebug.remote_mode=req
xdebug.remote_host=localhost
xdebug.remote_port=9000

; General
xdebug.auto_trace=off
xdebug.collect_includes=on
xdebug.collect_params=off
xdebug.collect_return=off
xdebug.default_enable=on
xdebug.extended_info=1
xdebug.manual_url=http://www.php.net
xdebug.show_local_vars=0 (tried with 1, same result)
xdebug.show_mem_delta=0
xdebug.max_nesting_level=100
;xdebug.idekey=

; Trace options
xdebug.trace_format=0
xdebug.trace_output_dir=/tmp
xdebug.trace_options=0
xdebug.trace_output_name=crc32

; Profiling
xdebug.profiler_append=0
xdebug.profiler_enable=0
xdebug.profiler_enable_trigger=0
xdebug.profiler_output_dir=/tmp
xdebug.profiler_output_name=crc32
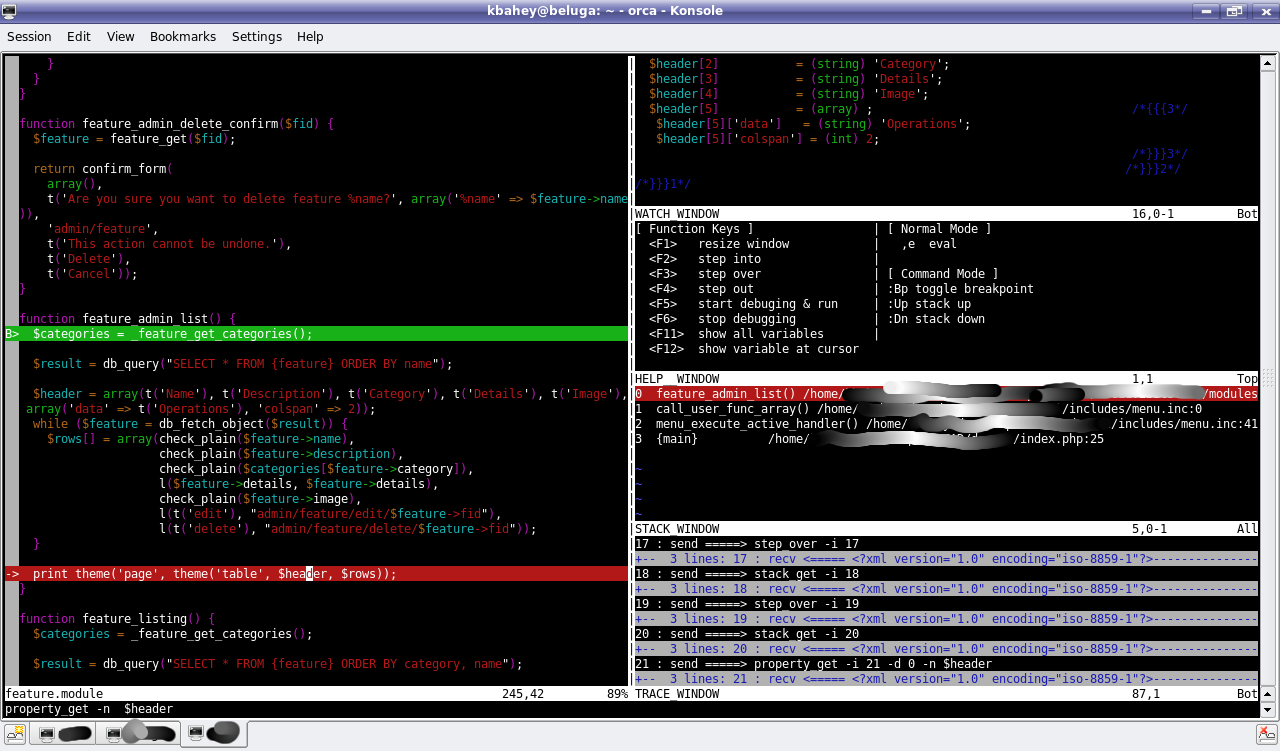
当我按 F12 显示变量内容时,而不是像此图像上的示例那样显示它 http://2bits.com/sites/2bits.com/files/vim-debug-displaying-variables.png (右上角窗口)我得到这个 /*{{{1*/ => property_get: file 当我在 $file var 上按 F12 时。
我还尝试了本文附带的版本 http: //2bits.com/articles/using-vim-and-xdebug-dbgp-for-debugging-drupal-or-any-php-application.html
相同的结果。
我还在这里发现了几乎相同的未回答问题 xdebug does not show the content数组?
预先感谢您的任何建议
I'm on Ubuntu 10.04 LTS
vim version 7.2.330
xdebug vim plugin version 1.1.1 (downloaded from http://www.vim.org/scripts/script.php?script_id=1929)
PHP 5.3.2
Apache/2.2.14
Xdebug v2.0.5
I have these options in my /etc/php5/apache2/php.ini file
[debug]
; Remote settings
xdebug.remote_autostart=off
xdebug.remote_enable=on
xdebug.remote_handler=dbgp
xdebug.remote_mode=req
xdebug.remote_host=localhost
xdebug.remote_port=9000

; General
xdebug.auto_trace=off
xdebug.collect_includes=on
xdebug.collect_params=off
xdebug.collect_return=off
xdebug.default_enable=on
xdebug.extended_info=1
xdebug.manual_url=http://www.php.net
xdebug.show_local_vars=0 (tried with 1, same result)
xdebug.show_mem_delta=0
xdebug.max_nesting_level=100
;xdebug.idekey=

; Trace options
xdebug.trace_format=0
xdebug.trace_output_dir=/tmp
xdebug.trace_options=0
xdebug.trace_output_name=crc32

; Profiling
xdebug.profiler_append=0
xdebug.profiler_enable=0
xdebug.profiler_enable_trigger=0
xdebug.profiler_output_dir=/tmp
xdebug.profiler_output_name=crc32
When I press F12 to show variable content, instead of showing it like for example on this image http://2bits.com/sites/2bits.com/files/vim-debug-displaying-variables.png (top right window) I get this /*{{{1*/ => property_get: file when I press F12 on $file var.
I also tried the version that is attached to this article
http://2bits.com/articles/using-vim-and-xdebug-dbgp-for-debugging-drupal-or-any-php-application.html
Same result.
I also found almost the same unanswered question here xdebug does not show the content of array?
Thank you in advance for any advice
如果你对这篇内容有疑问,欢迎到本站社区发帖提问 参与讨论,获取更多帮助,或者扫码二维码加入 Web 技术交流群。

绑定邮箱获取回复消息
由于您还没有绑定你的真实邮箱,如果其他用户或者作者回复了您的评论,将不能在第一时间通知您!


发布评论
评论(2)
编辑 debugger.vim 文件 (~/.vim/plugin/debugger.vim) 并找到类似于将深度变量增加到合理数量的行
(5 应该足够了)
保存并重启vim。
Edit debugger.vim file (~/.vim/plugin/debugger.vim) and find a line similar to
increase the depth varibale to a reasonable amount (5 should be enough)
save and restart vim.
这并不能真正回答您的 xdebug 问题,但对于简单的变量内容检查,我发现 FirePHP 非常有用。
This doesn't really answer your xdebug question, but for simple variable contents checking I found FirePHP quite useful.