将笛卡尔坐标转换为图片框坐标c#
我的问题更多的是数学!我有一些值代表我想使用 fromImage(Bitmap) 在图片框上绘制的曲线点。我的图片框尺寸为 500x500。我还知道左上角的点为 (0,0),右下角的点为 (500,500)。显然原点应该是(250,250)。现在我想知道如何将我自己的值转换为这种格式?
我的样本点如下:
Voltage: -0.175         Current: -9.930625E-06
Voltage: -0.171875      Current: -9.53375E-06
Voltage: -0.16875       Current: -9.136875E-06
Voltage: -0.16875       Current: -8.74E-06
Voltage: -0.165625      Current: -8.343125E-06
Voltage: -0.1625        Current: -7.94625E-06
Voltage: -0.1625        Current: -7.549375E-06
Voltage: -0.159375      Current: -7.152188E-06
Voltage: -0.15625       Current: -6.755312E-06
您会看到电压值应位于 X 轴,电流值应位于 Y 轴。我知道为了让它们更好一点,我必须将它们乘以更大的数字,也可能乘以倒数或其他东西。但我仍然不知道如何在我的图片框中表示它们。这些点通常从第三象限开始,到第一象限结束。请帮忙!
只是补充一下,我的 X 轴最小值和最大值为 -2V 和 +2V,对于 Y 轴,我将有 -10uA 到 +10uA (即 10*10^-6)
编辑
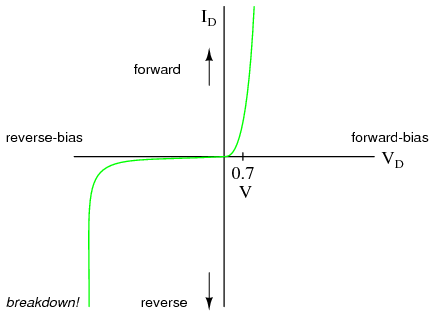
我正在尝试要做的就是拥有这样的曲线,因此我在 Graphics.DrawCurve 中使用这些点:

<强>更新 这就是我的代码的样子:
            g.DrawLine(penAxis, 250, 0, 250, 500); // Y AXIS
        g.DrawLine(penAxis, 0, 250, 500, 250); // X AXIS

        PointF[] p = new PointF[pinData.GetLength(0)];   //pinData is AboutBoxForm double[,] array

        for (int i = 0; i < pinData.GetLength(0); i++)
        {
            p[i] = new PointF(250 * ((1 + (float)pinData[i, 0]) / 2), 250 * ((1 + (float)pinData[i, 1] )/ 10));
        }

        Pen pengraph = new Pen(pinColor, 2.0F);
        g.DrawCurve(pengraph, p);
进展更新
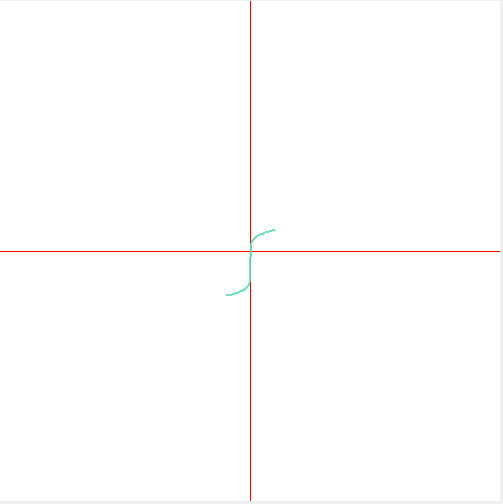
好的,现在使用曲线下方的代码如下:
            g.DrawLine(penAxis, 250, 0, 250, 500); // Y AXIS
        g.DrawLine(penAxis, 0, 250, 500, 250); // X AXIS

        PointF[] p = new PointF[pinData.GetLength(0)];   //pinData is AboutBoxForm double[,] array

        for (int i = 0; i < pinData.GetLength(0); i++)
        {
            p[i] = new PointF(250 * (1 - ((float)pinData[i, 1] *100000) / 10), 250 * (1 + (((float)pinData[i, 0]))/ 2));
        }

        Pen pengraph = new Pen(pinColor, 2.0F);
        g.DrawCurve(pengraph, p);

我认为现在的问题是缩放它。 已解决 我必须乘以 10^6,但我用 ^5 乘以,不,没关系!谢谢大家。
The question I have is more of mathematics! I have some pair of values that reperesent points of a curve that I want to draw on a picturebox using fromImage(Bitmap). My picture box is sized at 500x500. I also know that the top-left corner has point of (0,0) and bottom right corner has points of (500,500). Obviously the origin should be (250,250). Now I am wondering how can I convert my own values to this format?
A sample points that I have are like:
Voltage: -0.175         Current: -9.930625E-06
Voltage: -0.171875      Current: -9.53375E-06
Voltage: -0.16875       Current: -9.136875E-06
Voltage: -0.16875       Current: -8.74E-06
Voltage: -0.165625      Current: -8.343125E-06
Voltage: -0.1625        Current: -7.94625E-06
Voltage: -0.1625        Current: -7.549375E-06
Voltage: -0.159375      Current: -7.152188E-06
Voltage: -0.15625       Current: -6.755312E-06
You see there are Voltage values which should be on X axis and Current on Y axis. I know that to make them a bit better I have to multiply them in a bigger number and also maybe multiply by an inverse or something. but I still cant figure out how to represent them on my picturebox. These points are usually start from 3rd quadrant and end up in first quadrant. Please assist!
Just to add that my X axis min and max are -2V and +2V and for Y Axis I would have -10uA to +10uA (that is 10*10^-6)
EDIT
What I am trying to do is have a curve like these, so those points I have are used in Graphics.DrawCurve:

UPDATE
This is how my code looks like:
            g.DrawLine(penAxis, 250, 0, 250, 500); // Y AXIS
        g.DrawLine(penAxis, 0, 250, 500, 250); // X AXIS

        PointF[] p = new PointF[pinData.GetLength(0)];   //pinData is AboutBoxForm double[,] array

        for (int i = 0; i < pinData.GetLength(0); i++)
        {
            p[i] = new PointF(250 * ((1 + (float)pinData[i, 0]) / 2), 250 * ((1 + (float)pinData[i, 1] )/ 10));
        }

        Pen pengraph = new Pen(pinColor, 2.0F);
        g.DrawCurve(pengraph, p);
PROGRESS UPDATE
ok now using the code below my curve looks like:
            g.DrawLine(penAxis, 250, 0, 250, 500); // Y AXIS
        g.DrawLine(penAxis, 0, 250, 500, 250); // X AXIS

        PointF[] p = new PointF[pinData.GetLength(0)];   //pinData is AboutBoxForm double[,] array

        for (int i = 0; i < pinData.GetLength(0); i++)
        {
            p[i] = new PointF(250 * (1 - ((float)pinData[i, 1] *100000) / 10), 250 * (1 + (((float)pinData[i, 0]))/ 2));
        }

        Pen pengraph = new Pen(pinColor, 2.0F);
        g.DrawCurve(pengraph, p);

I think now the problem is scaling it. SOLVED I had to multiply by 10^6 but I did with ^5 no it is ok!!! Thanks all.
如果你对这篇内容有疑问,欢迎到本站社区发帖提问 参与讨论,获取更多帮助,或者扫码二维码加入 Web 技术交流群。

绑定邮箱获取回复消息
由于您还没有绑定你的真实邮箱,如果其他用户或者作者回复了您的评论,将不能在第一时间通知您!

发布评论
评论(2)
要使用图片框的整个范围,将
(V,C) = (0, 0)映射到中心,您可以使用转换:请注意,这将使 Current 增加 < em>Y 轴向上。如果您想要相反,请在第二个转换中使用
(1 + Current/10)。To use the entire range of the picture box, with
(V,C) = (0, 0)being mapped to the centre, you can use the transformations:Do note that this will make Current increase upward on the Y axis. If you want the reverse, use
(1 + Current/10)in the second transformation.如果您想要缩放以适应屏幕,请将每个电压和电流值乘以50。
您的所有点都位于
第三象限;您可以在屏幕上选择原点(0, 0),并将所有负x轴点设为正值,即沿y轴翻转。如果您不想缩放,请保持乘法因子统一。
If you want scaling to fit screen multiply each voltage and current value by 50.
All your points lie in
third quadrant; you can choose origin(0, 0)on your screen and make all yournegative x-axispoints positive, i.e. flip alongy-axis.If you don't want scaling, keep multiplication factor unity.