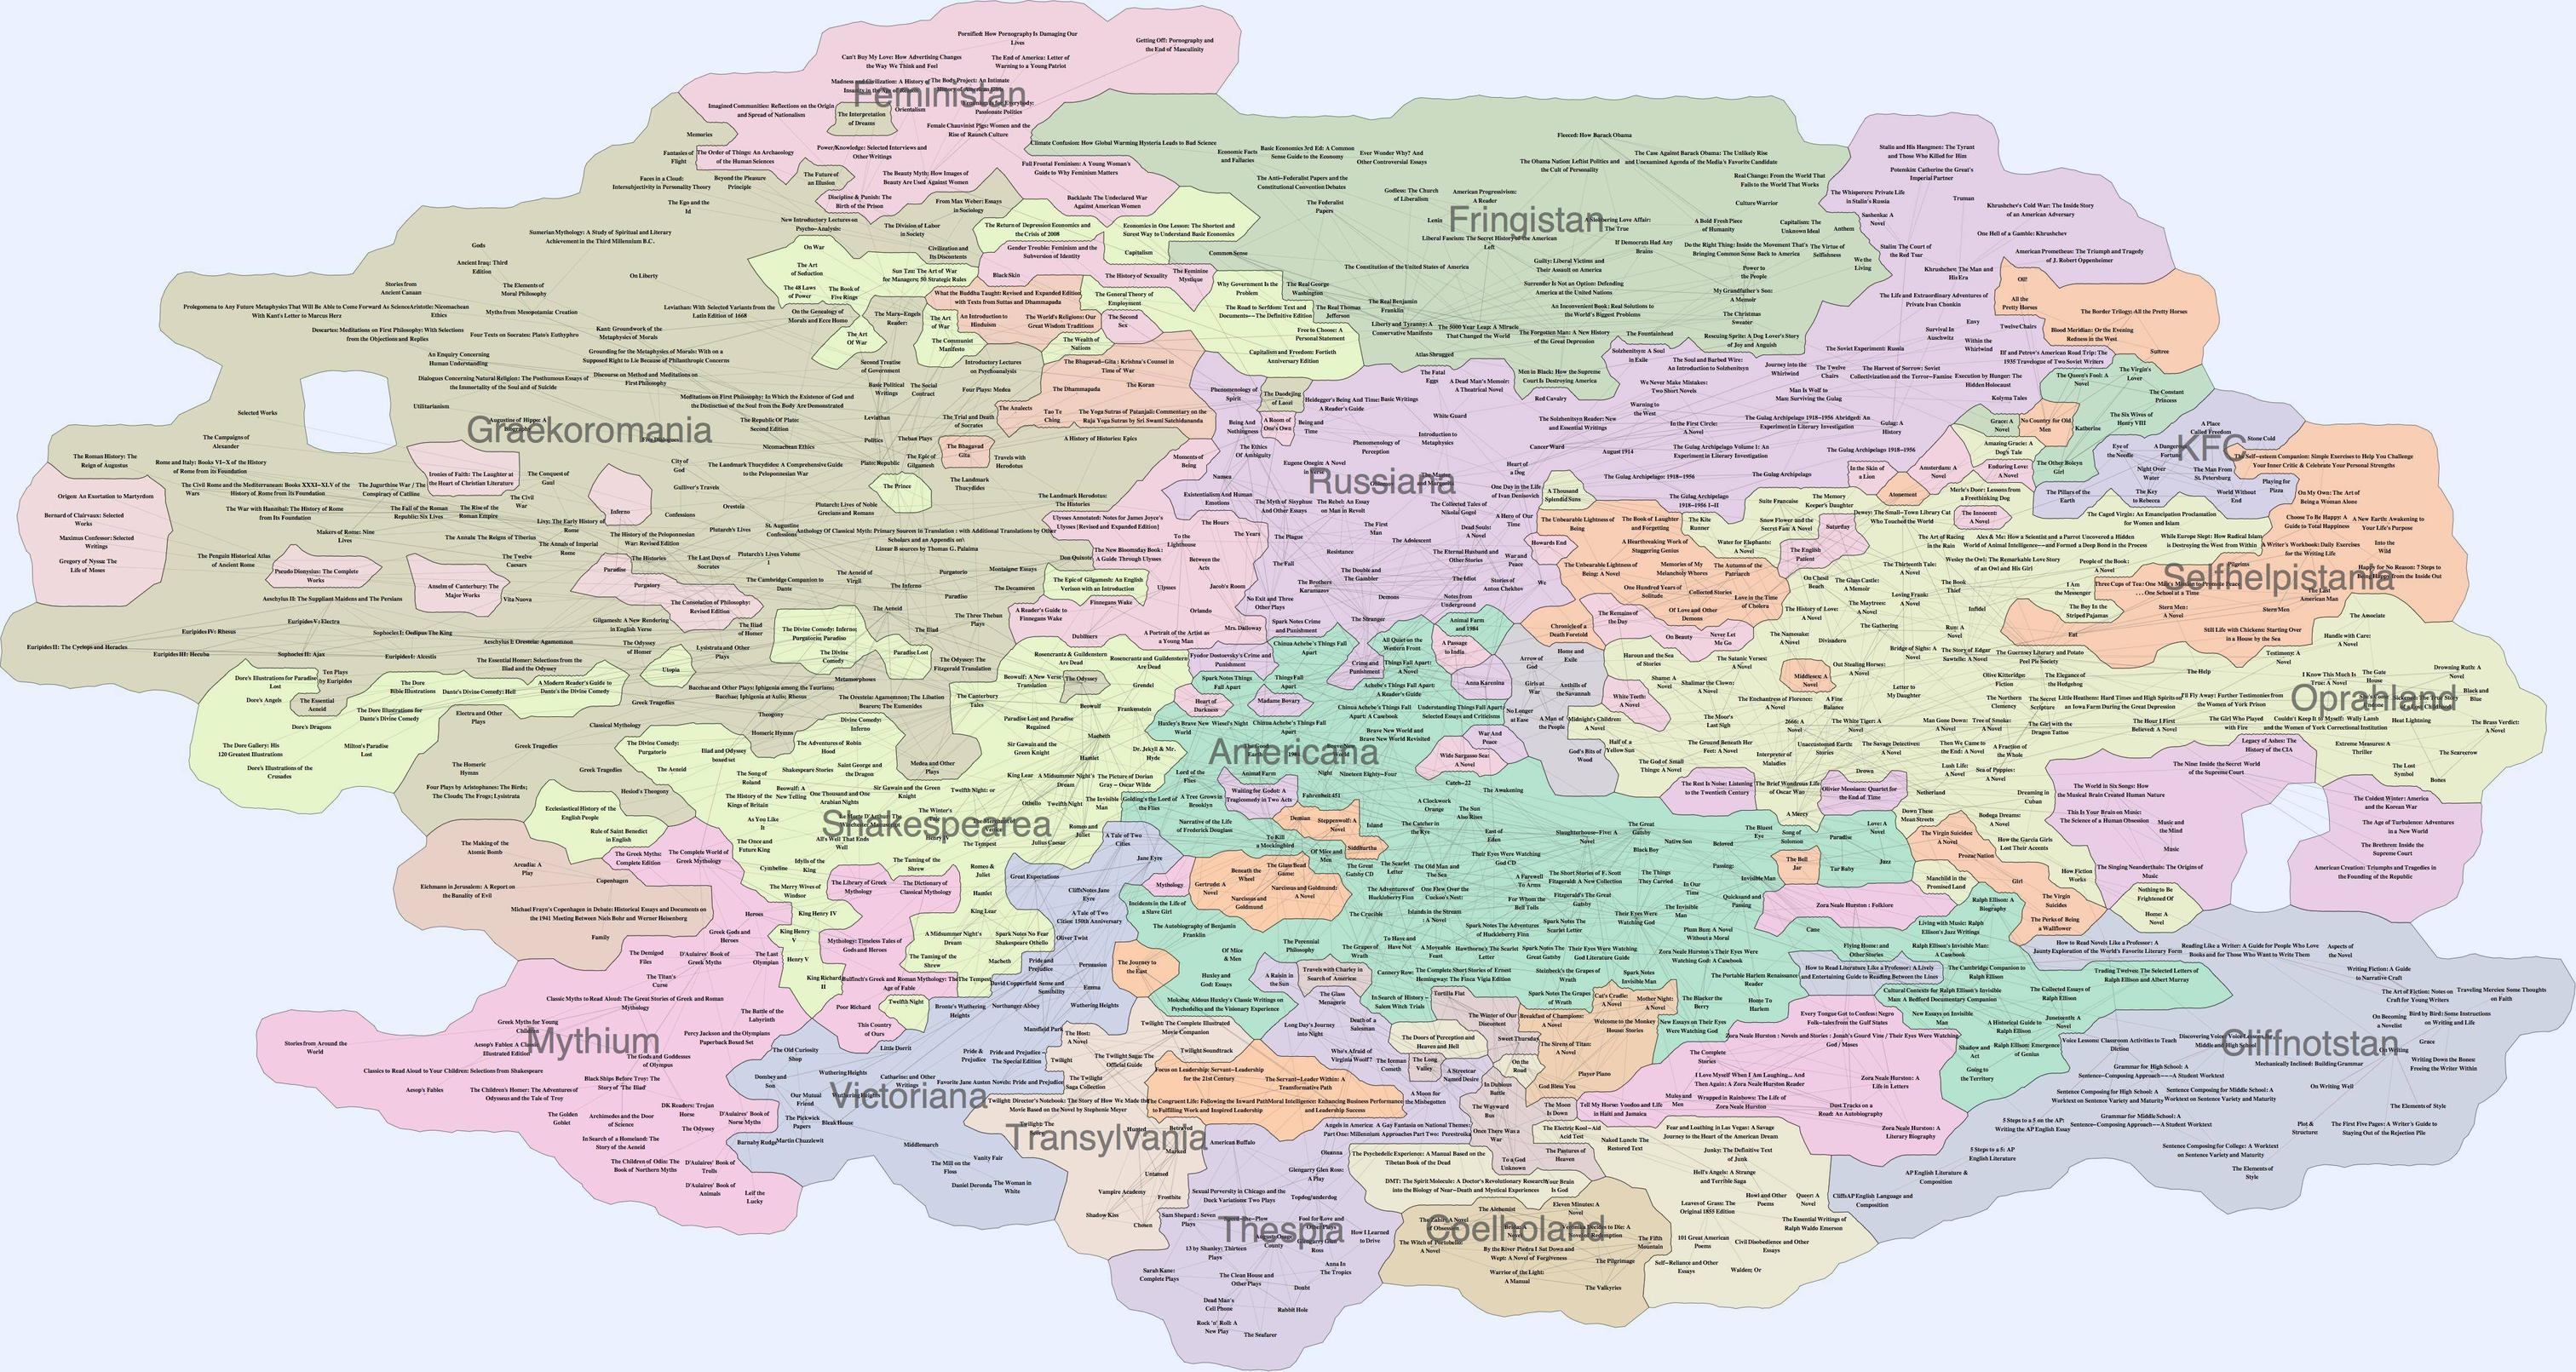
如何结合网络图和想象图来生成可视化效果?
基本上,我正在寻找这样一个很棒的研究项目:Gmap,在这个相关的SO问题中引用了。
这是一种相当新颖的数据可视化,它将网络图与一组看起来像地图的假想区域结合在一起。基本上,地图化可以帮助人类更好地理解庞大的数据集。

酷吧? GMap 似乎不是开源的,但我打算联系作者。
我已经知道如何创建具有强制导向布局的网络图(当前使用 Prefuse/Flare),因此答案可能是在现有图之上分层映射算法的方法。我现在也不关心客户端 - 这将是一个后端进程,并且我在这个阶段对技术堆栈和数据输出很灵活。
还有本文描述了支持 GMap 的算法。如果您听说过沃罗诺伊图(它很震撼,但让我头疼),这篇文章适合您。不过,我在 Calc 1 之后就退出了,所以我希望避免记住 sigma 和 epsilon 是什么。
Basically, I'm looking for something like this awesome research project: Gmap, which was referenced in this related SO question.
It's a rather novel data visualization that combines a network graph with an imaginary set of regions that looks like a map. Basically, the map-ification helps humans comprehend the enormous data set better.

Cool, huh? GMap doesn't appear to be open source, though I plan to contact the authors.
I already know how to create a network graph with a force-directed layout (currently using Prefuse/Flare), so an answer could be a way to layer a mapping algorithm on top of an existing graph. I'm also not concerned about the client-side at all right now - this would be a backend process, and I am flexible about technology stack and data output at this stage.
There's also this paper that describes the algorithm backing GMap. If you have heard of Voronoi diagrams (which rock, but make my head hurt), this paper is for you. I quit after Calc 1, though, so I'm hoping to avoid remembering what sigmas and epsilons are.
如果你对这篇内容有疑问,欢迎到本站社区发帖提问 参与讨论,获取更多帮助,或者扫码二维码加入 Web 技术交流群。

绑定邮箱获取回复消息
由于您还没有绑定你的真实邮箱,如果其他用户或者作者回复了您的评论,将不能在第一时间通知您!

发布评论
评论(1)
首先,你能做一个简单的最近点排序算法吗?所以它看起来像这样:你有你的力导向布局并计算了某种边界框。现在你想要渲染它。调整边界框以与原点对齐,然后在计算每个像素的颜色时找到它最近的点。这应该会生成一些相似的区域,并且应该很容易尝试。当然,它不会像 GMap 那样漂亮,但也许是一个开始?运行时会很糟糕,但是......我不了解你,但直接计算边界线对我来说听起来要困难得多。
As a start, could you do a simple closest point sort of an algorithm? So it looks something like this: You have your force directed layout and have computed some sort of bounding box. Now you want to render it. Adjust your bounding box to line up to the origin and then as you calculate the color of each pixel, find it's closest point. This should generate some semblance of regions and should be quite simple to try out. Of course, it isn't going to be as pretty as GMap, but maybe a start? The runtime would be awful, but... I don't know about you but computing boundary lines directly sounds a lot harder to me.