ZedGraph 雷达图
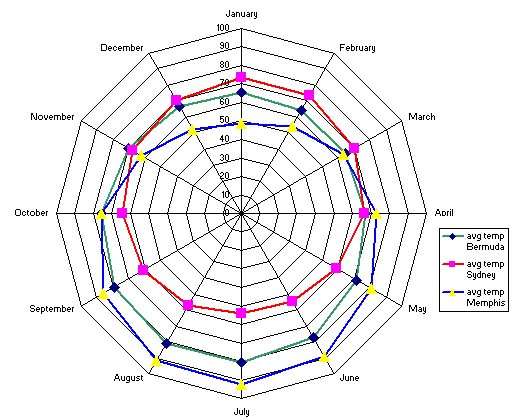
ZedGraph API 是否允许我们创建雷达图?雷达图的示例可以在 http://www.internet4classrooms.com/excel_files/ 中查看radar_chart3.gif 也在下面列出。
使用语言:C#,动态从数据库获取数据并显示在雷达图上。

Does the ZedGraph API allow us to create a radar chart? An example of a radar chart can be seen at http://www.internet4classrooms.com/excel_files/radar_chart3.gif and is also listed below.
Language used: C#, getting data from a database dynamically and shown on the radar chart.
如果你对这篇内容有疑问,欢迎到本站社区发帖提问 参与讨论,获取更多帮助,或者扫码二维码加入 Web 技术交流群。

绑定邮箱获取回复消息
由于您还没有绑定你的真实邮箱,如果其他用户或者作者回复了您的评论,将不能在第一时间通知您!


发布评论
评论(2)
您可以在 ZedGraph 中使用极坐标图或任何类似类型的图表来完成此操作,这里有一些示例:
[链接已损坏] http://zedgraph.org/wiki/index.php?title=Polar_Plot_Demo
这应该向您展示如何制作这样的图表。应该没有什么问题。
也许还可以看看这个例子:
[链接已损坏]
http://zedgraph.org/wiki/index.php?title=Contour_Chart_Demo
You can do it in ZedGraph using polar plot or any similar type of chart, here is some example:
[link broken] http://zedgraph.org/wiki/index.php?title=Polar_Plot_Demo
This should show you how you can do a chart like this. It shouldn't be any problem.
maybe also take a look on this example:
[link broken]
http://zedgraph.org/wiki/index.php?title=Contour_Chart_Demo
我不认为你可以在 ZedGraph 中做到这一点,但我确实在 VB.NET 中遇到了这个示例(它可能很容易转换为 C#),用于不同的图表应用程序:OpenFlashChart - 使用 VB.NET 的雷达图示例。
I don't think you can do it in ZedGraph, but I did come across this example in VB.NET (it could probably easily be translated to C#) for a different charting application: OpenFlashChart - A radar chart example with VB.NET.