了解 malloc_history 转储
如果您曾经问过如何调试 Objective-C 中的释放/分配问题,您将遇到这些可以帮助跟踪问题的环境设置:
NSZombieEnabled- 在发布后保留 abjects,因此您可以获取指针等。MallocStackLogging- 保留对象历史记录以供稍后参考NSDebugEnabled
您可以在“环境”部分中将所有这些设置为 YES “可执行文件”(在组树中找到)信息中的“参数”选项卡。
所以,我得到这个控制台输出
MyApp [4413:40b] -[CALayer keepCount]:消息发送至 已释放的实例0x4dbb170
然后打开终端,而调试器已转发中断并键入:
malloc_history 4413 0x4dbb170
然后,我得到一个大文本转储,据我所知,重要的一点是:
1
ALLOC 0x4dbb160-0x4dbb171 [size=18]:
thread_a0375540 |start | main |
UIApplicationMain | GSEventRun |
GSEventRunModal | CFRunLoopRunInMode |
CFRunLoopRunSpecific | __CFRunLoopRun
| __CFRunLoopDoTimer |
__CFRUNLOOP_IS_CALLING_OUT_TO_A_TIMER_CALLBACK_FUNCTION__
| __NSFireDelayedPerform |
-[todoListViewController drillDocumentMenu:] |
-[documentListViewController drillIntoDocumentWithToDoRecord:] |
-[documentViewController OpenTodoDocument:OfType:WithPath:] |
-[documentViewController OpenDocumentOfType:WithPath:] |
-[documentViewController managePDFDocumentWithPath:] |
-[PDFDocument loadPDFDocumentWithPath:andTitle:] |
-[PDFDocument getMetaData] | CGPDFDictionaryApplyFunction |
ListDictionaryObjects(char const*,
CGPDFObject*, void*) | NSLog | NSLogv
| _CFLogvEx | __CFLogCString |
asl_send | _asl_send_level_message |
asl_set_query | strdup | malloc |
malloc_zone_malloc
2
FREE  0x4dbb160-0x4dbb171 [size=18]:
thread_a0375540 |start | main |
UIApplicationMain | GSEventRun |
GSEventRunModal | CFRunLoopRunInMode |
CFRunLoopRunSpecific | __CFRunLoopRun
| __CFRunLoopDoTimer |
__CFRUNLOOP_IS_CALLING_OUT_TO_A_TIMER_CALLBACK_FUNCTION__
| __NSFireDelayedPerform |
-[todoListViewController drillDocumentMenu:] |
-[documentListViewController drillIntoDocumentWithToDoRecord:] |
-[documentViewController OpenTodoDocument:OfType:WithPath:] |
-[documentViewController OpenDocumentOfType:WithPath:] |
-[documentViewController managePDFDocumentWithPath:] |
-[PDFDocument loadPDFDocumentWithPath:andTitle:] |
-[PDFDocument getMetaData] | CGPDFDictionaryApplyFunction |
ListDictionaryObjects(char const*,
CGPDFObject*, void*) | NSLog | NSLogv
| _CFLogvEx | __CFLogCString |
asl_send | _asl_send_level_message |
asl_free | free
3
ALLOC 0x4dbb170-0x4dbb19f [size=48]:
thread_a0375540 |start | main |
UIApplicationMain | GSEventRun |
GSEventRunModal | CFRunLoopRunInMode |
CFRunLoopRunSpecific | __CFRunLoopRun
| __CFRunLoopDoTimer |
__CFRUNLOOP_IS_CALLING_OUT_TO_A_TIMER_CALLBACK_FUNCTION__
| __NSFireDelayedPerform |
-[todoListViewController drillDocumentMenu:] |
-[documentListViewController drillIntoDocumentWithToDoRecord:] |
-[documentViewController OpenTodoDocument:OfType:WithPath:] |
-[documentViewController OpenDocumentOfType:WithPath:] |
-[documentViewController managePDFDocumentWithPath:] |
-[ScrollViewWithPagingViewController init] | -[UIView init] |
-[UIScrollView initWithFrame:] | -[UIView initWithFrame:] | UIViewCommonInitWithFrame | -[UIView
_createLayerWithFrame:] | +[NSObject(NSObject) alloc] | +[NSObject(NSObject) allocWithZone:] | class_createInstance |
_internal_class_createInstanceFromZone | calloc | malloc_zone_calloc
但我不明白的是,如果它的历史是ALLOC,FREE,ALLOC 那么为什么错误提示已释放(net +1 alloc)?
还是我对dump的理解有误?
EDIT (fresh run= different object pointers):
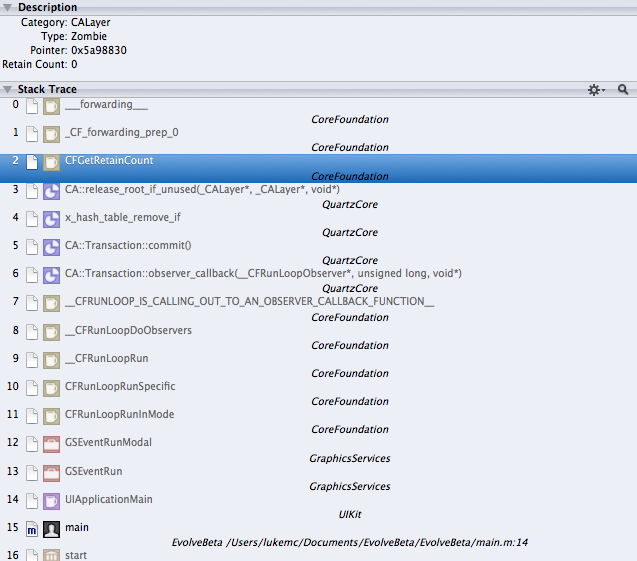
使用仪器进行僵尸检测:

保留计数为什么以及如何从 1 跳到 -1?
看看 Zombie 的回溯,看起来保留计数正在被调用: Quartz 通过 release_root_if_unused
编辑:< strong>已解决 - 我正在从 super 中删除一个视图,然后释放它。只需释放它即可修复。
If you have ever asked how can I debug releasing/alloc issues in objective-c, you will have came across these environment settings that can help track the problem down:
NSZombieEnabled- Keeps abjects around after release, so you can get pointers etc.MallocStackLogging- keeps object history for reference laterNSDebugEnabled
You set all of these to YES in the 'environment' section of the 'arguments' tab in the 'executables' (found in group tree) info.
So, Im getting this console output
MyApp [4413:40b] -[CALayer
retainCount]: message sent to
deallocated instance 0x4dbb170
then open terminal, while the debugger has forwarded the break and type:
malloc_history 4413 0x4dbb170
Then, I get a big text dump, and as far as I understand the important bit is this:
1
ALLOC 0x4dbb160-0x4dbb171 [size=18]:
thread_a0375540 |start | main |
UIApplicationMain | GSEventRun |
GSEventRunModal | CFRunLoopRunInMode |
CFRunLoopRunSpecific | __CFRunLoopRun
| __CFRunLoopDoTimer |
__CFRUNLOOP_IS_CALLING_OUT_TO_A_TIMER_CALLBACK_FUNCTION__
| __NSFireDelayedPerform |
-[todoListViewController drillDocumentMenu:] |
-[documentListViewController drillIntoDocumentWithToDoRecord:] |
-[documentViewController OpenTodoDocument:OfType:WithPath:] |
-[documentViewController OpenDocumentOfType:WithPath:] |
-[documentViewController managePDFDocumentWithPath:] |
-[PDFDocument loadPDFDocumentWithPath:andTitle:] |
-[PDFDocument getMetaData] | CGPDFDictionaryApplyFunction |
ListDictionaryObjects(char const*,
CGPDFObject*, void*) | NSLog | NSLogv
| _CFLogvEx | __CFLogCString |
asl_send | _asl_send_level_message |
asl_set_query | strdup | malloc |
malloc_zone_malloc
2
FREE  0x4dbb160-0x4dbb171 [size=18]:
thread_a0375540 |start | main |
UIApplicationMain | GSEventRun |
GSEventRunModal | CFRunLoopRunInMode |
CFRunLoopRunSpecific | __CFRunLoopRun
| __CFRunLoopDoTimer |
__CFRUNLOOP_IS_CALLING_OUT_TO_A_TIMER_CALLBACK_FUNCTION__
| __NSFireDelayedPerform |
-[todoListViewController drillDocumentMenu:] |
-[documentListViewController drillIntoDocumentWithToDoRecord:] |
-[documentViewController OpenTodoDocument:OfType:WithPath:] |
-[documentViewController OpenDocumentOfType:WithPath:] |
-[documentViewController managePDFDocumentWithPath:] |
-[PDFDocument loadPDFDocumentWithPath:andTitle:] |
-[PDFDocument getMetaData] | CGPDFDictionaryApplyFunction |
ListDictionaryObjects(char const*,
CGPDFObject*, void*) | NSLog | NSLogv
| _CFLogvEx | __CFLogCString |
asl_send | _asl_send_level_message |
asl_free | free
3
ALLOC 0x4dbb170-0x4dbb19f [size=48]:
thread_a0375540 |start | main |
UIApplicationMain | GSEventRun |
GSEventRunModal | CFRunLoopRunInMode |
CFRunLoopRunSpecific | __CFRunLoopRun
| __CFRunLoopDoTimer |
__CFRUNLOOP_IS_CALLING_OUT_TO_A_TIMER_CALLBACK_FUNCTION__
| __NSFireDelayedPerform |
-[todoListViewController drillDocumentMenu:] |
-[documentListViewController drillIntoDocumentWithToDoRecord:] |
-[documentViewController OpenTodoDocument:OfType:WithPath:] |
-[documentViewController OpenDocumentOfType:WithPath:] |
-[documentViewController managePDFDocumentWithPath:] |
-[ScrollViewWithPagingViewController init] | -[UIView init] |
-[UIScrollView initWithFrame:] | -[UIView initWithFrame:] | UIViewCommonInitWithFrame | -[UIView
_createLayerWithFrame:] | +[NSObject(NSObject) alloc] | +[NSObject(NSObject) allocWithZone:] | class_createInstance |
_internal_class_createInstanceFromZone | calloc | malloc_zone_calloc
What i don't understand though is if it the history was ALLOC,FREE,ALLOC then why does the error indicate that it was released (net +1 alloc)?
or is my understanding of the dump wrong?
EDIT (fresh run= different object pointers):
Zombie Detection with instruments:
Why and how, does the retain count jump from 1 to -1?
Looking at the backtrace of the Zombie, looks like the retain count is being called by: Quartz through release_root_if_unused
Edit: Solved- I was removing a view from super, then releasing it. Fixed by just releasing it.
如果你对这篇内容有疑问,欢迎到本站社区发帖提问 参与讨论,获取更多帮助,或者扫码二维码加入 Web 技术交流群。

绑定邮箱获取回复消息
由于您还没有绑定你的真实邮箱,如果其他用户或者作者回复了您的评论,将不能在第一时间通知您!


发布评论
评论(2)
@Kay是正确的; malloc 历史记录显示指定地址处的两次分配;一个已分配并释放,一个仍在使用。
您需要的是对已发布的
CALayer上的retainCount调用的回溯。因为您启用了僵尸检测,除了其他内存调试之外,释放可能根本就没有发生。不会发生。将 malloc 历史记录与僵尸检测混合会显着改变运行时行为。
我建议在 Instruments 中运行僵尸检测。希望这能查明确切的问题。
如果没有,那么您可以设置一个断点,以便在向僵尸发送消息时中断。设置该断点并查看停止的位置。
好的——所以,CoreAnimation 将保留计数用于内部目的(系统框架可以摆脱这一点,尽管它很脆弱)。
我认为 -1 是转移注意力的;僵尸很可能返回 0xFF....FFFF 作为保留计数,这在 Instruments 中呈现为 -1。
下一个最佳猜测;由于这是在计时器中发生的,因此过度释放可能发生在动画期间。 CoreAnimation 层应该正确处理这个问题。代码中存在视图或动画层容器的过度释放,导致该层过早消失。
您尝试过“构建和分析”吗?它偶尔可能会在某个地方发现视图管理不善。
无论如何,作为一个实验,尝试多保留你的观点一段时间,看看这是否能让这个问题停止。如果确实如此,那至少是一条线索。
(或者它可能是系统框架中的一个错误......也许......但值得怀疑。)
最后,到底是谁在调用
retainCount?!?!?对于 CoreAnimation,retainCount可能在内部用作实现细节。不过,如果这是您的代码,那么僵尸调用的位置应该非常明显。
@Kay is correct; the malloc history is showing two allocations at the specified address; one that has been allocated and freed and one that is still in play.
What you need is the backtrace of the call to
retainCounton theCALayerthat has already been released. Because you have zombie detection enabled, amongst other memory debugging things, it may be that the deallocation simply has not & will not happen.Mixing malloc history with zombie detection changes the runtime behavior significantly.
I'd suggest running with zombie detection in Instruments. Hopefully, that'll pinpoint the exact problem.
If not, then there is a breakpoint you can set to break when a zombie is messaged. Set that breakpoint and see where you stop.
OK -- so, CoreAnimation is using the retain count for internal purposes (the system frameworks can get away with this, fragile though it is).
I think the -1 is a red herring; it is likely that zombies return 0xFF....FFFF as the retain count and this is rendered as -1 in Instruments.
Next best guess; since this is happening in a timer, the over-release is probably happening during animation. The CoreAnimation layers should handle this correctly. There is an over-release of a view or animation layer container in your code that is causing the layer to go away prematurely.
Have you tried "Build and Analyze"? Off-chance it might catch the mismanagement of a view somewhere.
In any case and as an experiment, try retaining your view(s) an extra time and see if that makes this problem stop. If it does, that is, at least, a clue.
(Or it might be a bug in the system frameworks... maybe... but doubtful.)
Finally, who the heck is calling
retainCount?!?!? In the case of CoreAnimation, it is possible that theretainCountis being used internally as an implementation detail.If it is your code, though, then the location of the zombie call should be pretty apparent.
我不是专家,但如果你看一下第 3 块中的第一行:
在另外两个输出中,分配并释放了位于 0x4dbb160-0x4dbb171 处大小为 18 的内存块。我假设旧对象已被释放,并且该内存地址驻留有一个新对象。因此 0x...b160 处的旧实例不再有效。
I am no expert, but if you take a look at the first line in block 3:
While in the other two outputs a memory block of size 18 at 0x4dbb160-0x4dbb171 was allocated and freed. I assume the old object was freed and there is a new object residing at this memory address. Thus the old instance at 0x...b160 is not valid any longer.