R:lattice.qq 如何制作处理[x] 与对照的多面板图?
我有一个看起来像这样的数据框:
str(Data)
'data.frame':   11520 obs. of  29 variables:
 $ groupname  : Factor w/ 8 levels "Control","Treatment1",..: 1 1 1 1 1 1 1 1 1 1 ...
 $ fCycle     : Factor w/ 2 levels "Dark","Light": 2 2 2 2 2 2 2 2 2 2 ...
 $ totdist    : num  0 67.5 89.8 109.1 58.3 ...
 #etc.
我可以像这样绘制治疗1与控制的单个图:
qq(groupname~totdist|fCycle, data=Data,
 subset=(groupname=='Control'|groupname=='Treatment1'))
它看起来像这样:
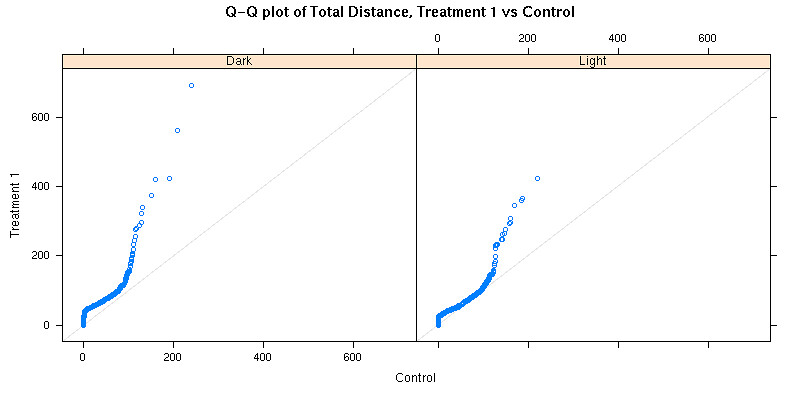
我想自动制作Treatment2 vs Control ...TreatmentX vs Control 的类似图。这是循环的地方还是格子有更好的方法?
I have a dataframe that looks like this:
str(Data)
'data.frame':   11520 obs. of  29 variables:
 $ groupname  : Factor w/ 8 levels "Control","Treatment1",..: 1 1 1 1 1 1 1 1 1 1 ...
 $ fCycle     : Factor w/ 2 levels "Dark","Light": 2 2 2 2 2 2 2 2 2 2 ...
 $ totdist    : num  0 67.5 89.8 109.1 58.3 ...
 #etc.
I can do a single plot of Treatment1 vs Control like this:
qq(groupname~totdist|fCycle, data=Data,
 subset=(groupname=='Control'|groupname=='Treatment1'))
It looks like this:
I'd like to automatically make similar plots of Treatment2 vs Control ...TreatmentX vs Control. Is this the place for a loop or does lattice have a better way?
如果你对这篇内容有疑问,欢迎到本站社区发帖提问 参与讨论,获取更多帮助,或者扫码二维码加入 Web 技术交流群。

绑定邮箱获取回复消息
由于您还没有绑定你的真实邮箱,如果其他用户或者作者回复了您的评论,将不能在第一时间通知您!


发布评论
评论(1)
要在单个面板上执行此操作需要进行一些重新排列。首先,我将生成一个与您的结构相同的示例数据集
接下来,添加一个变量来区分治疗和控制(即
"Treatment2"被重新编码为"Treatment"等)然后重新排列数据集,以便为每个治疗组提供控制数据的副本
最后我们可以制作所需的图表
如果您想为每个治疗单独绘制图,那么循环会更好
To do this on a single panel takes some re-arranging. First, I'll generate a sample data set with the same kind of structure as yours
Next, add a variable to distinguish between treatment and control (i.e.
"Treatment2"is recoded as"Treatment", etc.)Then rearrange the data-set so that each treatment group is given a copy of the control data
Finally we can make the desired graph
If you want separate plots for each treatment, then a loop would be better