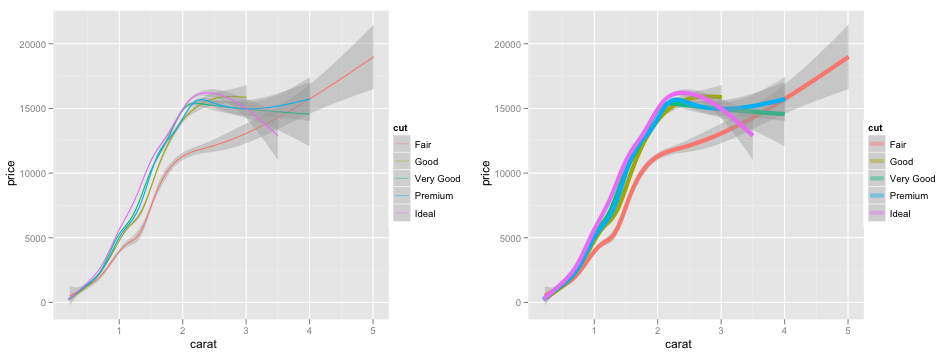
R:ggplot2,为什么我的图例显示褪色?
为什么我的图例在下面的这些示例中消失了?请注意图例中的颜色并不像图中的颜色那么鲜艳:
library(ggplot2)
r <- ggplot(data = diamonds, aes(x = carat, y = price, color = cut, group = cut))
r + geom_smooth() #(left)
r + geom_smooth(size = 2)  #(right)
编辑:添加了特写镜头 替代文本 http://img163.imageshack.us/img163/4715/screenshot20100411at725.png< /a>
Why is my legend faded in these examples below? Notice how the colours in the legend are not as vivid as the colours in the plot:
library(ggplot2)
r <- ggplot(data = diamonds, aes(x = carat, y = price, color = cut, group = cut))
r + geom_smooth() #(left)
r + geom_smooth(size = 2)  #(right)
EDIT: added a close-up
alt text http://img163.imageshack.us/img163/4715/screenshot20100411at725.png
如果你对这篇内容有疑问,欢迎到本站社区发帖提问 参与讨论,获取更多帮助,或者扫码二维码加入 Web 技术交流群。

绑定邮箱获取回复消息
由于您还没有绑定你的真实邮箱,如果其他用户或者作者回复了您的评论,将不能在第一时间通知您!


发布评论
评论(1)
我认为它们是相同的颜色 - 不同的环境使它们看起来不同。
I think they are the same colour - it's the different surrounds that make them look different.