如何在MATLAB中选择霍夫变换的最大强度?

发布于 2024-08-16 16:51:44 字数 448 浏览 2 评论 0 原文

Hough 变换之后/wiki/MATLAB" rel="nofollow noreferrer">MATLAB,如何选择线条以便可以在两个或更多图像之间进行比较?

我按照 Amro 给出的示例进行操作,实际上我想要检测的是第一张图片中的两行。然而,我得到的是第二张图片中的那个。我该怎么做?

替代文字

替代文本

After doing the Hough transform in MATLAB, how do I pick the lines so that I can compare between two or more images?

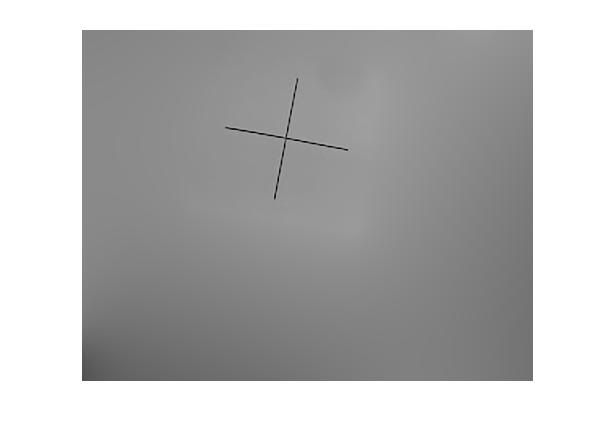
I followed the example given by Amro and actually what I wanted to detect is the two lines in the first picture. However, what I got is the one in the second picture. How can I do this?

Alt text

Alt text

如果你对这篇内容有疑问,欢迎到本站社区发帖提问 参与讨论,获取更多帮助,或者扫码二维码加入 Web 技术交流群。

扫码二维码加入Web技术交流群

发布评论

需要 登录 才能够评论, 你可以免费 注册 一个本站的账号。

评论(1

落花浅忆 2024-08-23 16:51:44

我认为您的目标是检测图像中的线条,而不是比较两个图像(?)。

无论如何,要找到由 霍夫变换 矩阵中的最大强度href="http://www.mathworks.com/help/images/ref/hough.html" rel="nofollow noreferrer">hough 函数,我们使用houghpeaks 函数,并向其传递要检测的所需峰值数量。


EDIT1:

我想我会添加一个示例来展示该过程:

%# Load image, process it, find edges
I  = rgb2gray( imread('pillsetc.png') );
I = imcrop(I, [30 30 450 350]);
J = imfilter(I, fspecial('gaussian', [17 17], 5), 'symmetric');
BW = edge(J, 'canny');

%# Perform Hough transform and show matrix
[H,T,R] = hough(BW);
imshow(imadjust(mat2gray(H)), [], 'XData',T, 'YData',R, ...
       'InitialMagnification','fit')
xlabel('\theta (degrees)'), ylabel('\rho')
axis on, axis normal, hold on
colormap(hot), colorbar

%# Detect peaks
P  = houghpeaks(H, 4);
plot(T(P(:,2)), R(P(:,1)), 'gs', 'LineWidth',2);

%# Detect lines and overlay on top of image
lines = houghlines(BW, T, R, P);
figure, imshow(I), hold on
for k = 1:length(lines)
    xy = [lines(k).point1; lines(k).point2];
    plot(xy(:,1), xy(:,2), 'g.-', 'LineWidth',2);
end
hold off

Accumulator matrix
带有重叠线条的图像


EDIT2:

根据您最近的更新,我仅通过对相同的内容进行一些更改就成功地检测到了这些线条上面的代码:

  • 我将区域裁剪为: [200 70 160 140]
  • 我使用了 sigma=3 的 11x11 高斯滤波器

注意:您必须添加偏移量才能获取线条中的位置未裁剪的原始图像。另外,如果您想要更准确的结果,您可能需要检测四行并获取中间的行,如下所示:

Four封闭行

I think you meant the goal to be to detect lines in an image, not comparing two images (?).

Anyway, to find the maximum intensities in the Hough transform matrix generated by the hough function, we use the houghpeaks function, and pass it the desired number of peaks to detect.


EDIT1:

I figured I would add an example to show the procedure:

%# Load image, process it, find edges
I  = rgb2gray( imread('pillsetc.png') );
I = imcrop(I, [30 30 450 350]);
J = imfilter(I, fspecial('gaussian', [17 17], 5), 'symmetric');
BW = edge(J, 'canny');

%# Perform Hough transform and show matrix
[H,T,R] = hough(BW);
imshow(imadjust(mat2gray(H)), [], 'XData',T, 'YData',R, ...
       'InitialMagnification','fit')
xlabel('\theta (degrees)'), ylabel('\rho')
axis on, axis normal, hold on
colormap(hot), colorbar

%# Detect peaks
P  = houghpeaks(H, 4);
plot(T(P(:,2)), R(P(:,1)), 'gs', 'LineWidth',2);

%# Detect lines and overlay on top of image
lines = houghlines(BW, T, R, P);
figure, imshow(I), hold on
for k = 1:length(lines)
    xy = [lines(k).point1; lines(k).point2];
    plot(xy(:,1), xy(:,2), 'g.-', 'LineWidth',2);
end
hold off

Accumulator matrix
Image with overlayed lines


EDIT2:

Following your recent update, I managed to detect the lines by only making a few changes to the same above code:

  • I cropped the region to: [200 70 160 140]
  • I used an 11x11 Gaussian filter with sigma=3

Note: You will have to add the offset to get the position of the lines in the original image uncropped. Also, if you want more accurate results, you might want to detect four lines and get the lines in the middle as shown below:

Four enclosing lines

~没有更多了~
我们使用 Cookies 和其他技术来定制您的体验包括您的登录状态等。通过阅读我们的 隐私政策 了解更多相关信息。 单击 接受 或继续使用网站,即表示您同意使用 Cookies 和您的相关数据。
原文