我的傅里叶变换中的奇怪人工制品
我已经在Matlab中对时间序列波形执行了fft(快速傅里叶变换),但实际上在傅里叶变换图中我似乎有一个奇怪的波,尽管有尖峰,但这个波看起来像我希望只在时域。是否有任何编程原因导致这种情况发生?
I have performed an fft (fast fourier transform) on a time series waveform in Matlab, but I seem to have a weird wave actually in the fourier transform plot, although there are spikes this wave looks like something I'd expect to see only in the time domain. Is there any programming reason why this could happen?

如果你对这篇内容有疑问,欢迎到本站社区发帖提问 参与讨论,获取更多帮助,或者扫码二维码加入 Web 技术交流群。

发布评论
评论(4)


星光不落少年眉2024-08-22 08:23:34
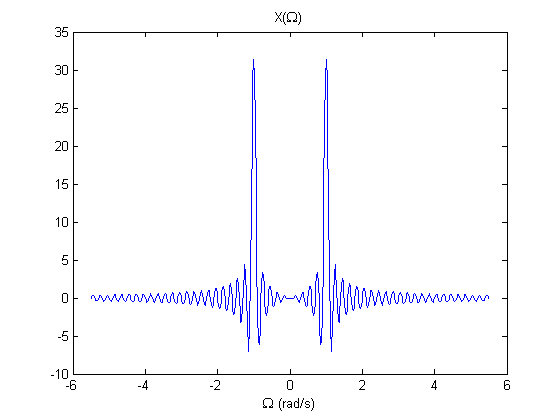
请注意,有限长度信号的连续时间傅里叶变换可能会在频域中出现看起来像“尖峰”的情况。请参阅此中的图余弦信号的单个周期和余弦信号的十个周期的连续时间傅里叶变换的帖子。
例如,无限范围的余弦信号具有简单的傅里叶变换,它是一对+/-余弦频率的脉冲。但是,如果您只有十个周期的余弦信号,则傅立叶变换如下所示:

~没有更多了~
绑定邮箱获取回复消息
由于您还没有绑定你的真实邮箱,如果其他用户或者作者回复了您的评论,将不能在第一时间通知您!


傅里叶变换与傅里叶逆变换非常相似。一个中的尖峰是另一个中的波。因此,如果您的系列中有一个异常值数据点,那么您将在频域中拥有一个波动分量。
一个可能的与编程相关的问题可能是未初始化的数据点,例如向 1024 点 FFT 提供 1023 个数据点。
The Fourier transform is quite similar to the Inverse Fourier Transform. A spike in one is a wave in the other. Hence, if you have one outlier datapoint in your series, you'll have a wave component in the frequency domain.
A possible programming-related issue could be an uninitialized data point, e.g. providing 1023 datapoints to a 1024-point FFT.