如何从等值线生成 3D 曲面?
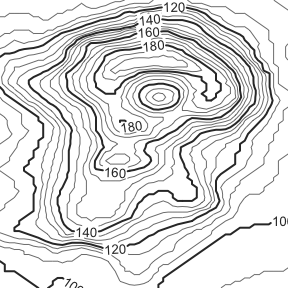
我有一组等值线点(或轮廓点),如下所示:
等值线上的每个点都有其各自的 X、Y 和 Z 坐标。由于它们是等值线,这意味着每个点将具有唯一的 XY 对,但同一条线上的点将具有相同的 Z 坐标。
现在,是否有任何算法或任何软件包(C# 或 C++ 或 MATLAB 语言)可以用来将等值线点插值到完整的 3-D 表面中?
P/S:我不仅对最终输出感兴趣,我对获取插值表面数据感兴趣,以便我可以自己绘制表面。
编辑:C++ 解决方案也受到欢迎。
I have a set of isoline points (or contour points) such as this:
Each point on an isoline has its own respective X, Y, and Z coordinate. Since they are isolines, that means that each point will have a unique X-Y pair, but points on the same line will have the same Z coordinate.
Now, is there any algorithm or any software packages (either in C# or C++ or MATLAB) that I can use to interpolate the isoline points into a full 3-D surface?
P/S: I am not just interested in the final output, I am interested in getting the interpolated surface data so that I can plot the surface myself.
Edit: C++ solutions are welcomed as well.
如果你对这篇内容有疑问,欢迎到本站社区发帖提问 参与讨论,获取更多帮助,或者扫码二维码加入 Web 技术交流群。

绑定邮箱获取回复消息
由于您还没有绑定你的真实邮箱,如果其他用户或者作者回复了您的评论,将不能在第一时间通知您!


发布评论
评论(4)
在 MATLAB 中,您可以使用函数
griddata或TriScatteredInterp类 (注意:从 R2013a 开始scatteredInterpolant是推荐的替代方案)。这两种方法都允许您将规则间隔的数据曲面拟合到一组非均匀间隔的点(尽管在较新的 MATLAB 版本中似乎不再建议使用griddata)。下面介绍了如何使用它们:griddata:其中
x,y,z分别表示每个点(在本例中为等高线上的点)的笛卡尔坐标向量。行向量XI和列向量YI是笛卡尔坐标,griddata在该坐标处对拟合的值ZI进行插值表面。矩阵XI,YI返回的新值与将XI,YI传递到meshgrid创建统一的点网格。TriScatteredInterp类:其中
x,y,z再次表示每个点的笛卡尔坐标向量,只是这次我使用了冒号重塑操作(:)以确保每个都是一个列向量 (TriScatteredInterp所需的格式)。然后使用矩阵XI,YI计算插值F,您必须使用meshgrid创建该矩阵。示例&比较
以下是一些示例代码及其生成的结果图,用于使用上述两种方法从轮廓数据重建表面。轮廓数据是使用
contour函数:请注意,两个结果之间几乎没有什么区别(至少在这个比例下)。另请注意,由于这些点处轮廓数据的稀疏性,插值曲面在拐角附近有空白区域。
In MATLAB you can use either the function
griddataor theTriScatteredInterpclass (Note: as of R2013ascatteredInterpolantis the recommended alternative). Both of these allow you to fit a surface of regularly-spaced data to a set of nonuniformly-spaced points (although it appearsgriddatais no longer recommended in newer MATLAB versions). Here's how you can use each:griddata:where
x,y,zeach represent vectors of the cartesian coordinates for each point (in this case the points on the contour lines). The row vectorXIand column vectorYIare the cartesian coordinates at whichgriddatainterpolates the valuesZIof the fitted surface. The new values returned for the matricesXI,YIare the same as the result of passingXI,YItomeshgridto create a uniform grid of points.TriScatteredInterpclass:where
x,y,zagain represent vectors of the cartesian coordinates for each point, only this time I've used a colon reshaping operation(:)to ensure that each is a column vector (the required format forTriScatteredInterp). The interpolantFis then evaluated using the matricesXI,YIthat you must create usingmeshgrid.Example & Comparison
Here's some sample code and the resulting figure it generates for reconstructing a surface from contour data using both methods above. The contour data was generated with the
contourfunction:Notice that there is little difference between the two results (at least at this scale). Also notice that the interpolated surfaces have empty regions near the corners due to the sparsity of contour data at those points.
您可以使用 MATLAB Central 文件中的 gridfit 工具交换。我给出的示例之一正是您想要做的,从从等值线获取的点列表开始,我根据数据重建平滑的表面。事实上,我使用的例子取自地形图。
You can use the gridfit tool, found on the MATLAB Central file exchange. One of the examples I give is exactly what you want to do, starting from a list of points taken from isolines, I reconstruct a smooth surface from the data. In fact, the example I used was taken from a topographic map.
我认为你想要的是所谓的“轮廓缝合”,例如在 this 中讨论的纸
I think what you want is called "Contour stitching", for example discussed in this paper
MATLAB 有一个名为 SURF 的内置命令采用 X、Y、Z 的三个数组并绘制曲面。这可能就是您正在寻找的。
MATLAB has a built-in command called SURF that takes three arrays for X,Y,Z and plots a surface. It might be what you're looking for.